1. At a Glance
NTPC Green Energy Ltd (NGEL) just reported a glowing Q1 FY26 with sales of ₹680 Cr (+18% YoY) and PAT of ₹220 Cr (+59% YoY). Margins stay at a sky-high 89% OPM, but the stock trades at a spicy P/E of 162 and 4.9x book value. Investors love the renewable dream—question is, for how long?
2. Introduction
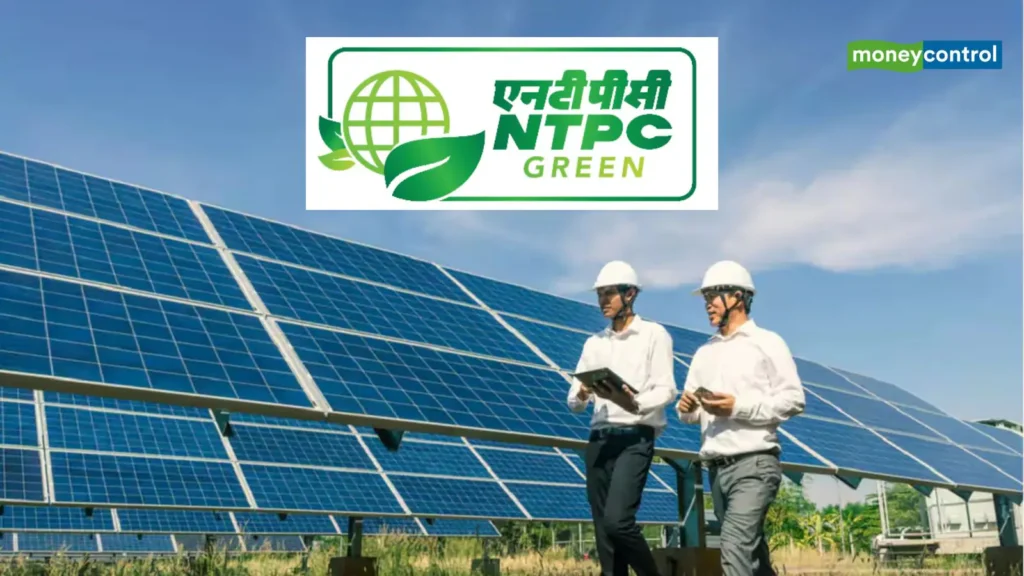
Imagine a startup in a PSU suit. NGEL, born in April 2022, is already India’s largest renewable public sector player (excluding hydro). With mega solar/wind PPAs and aggressive capacity additions, it’s chasing a 60 GW target by 2032. But with thin ROE and heavy capex, this “green” isn’t always cash-rich.
3. Business Model (WTF Do They Even Do?)
Simple: build solar/wind projects, sign long-term PPAs, collect fixed tariffs, and repeat. Throw in storage and hydrogen projects for future hype. Backed by NTPC, funding isn’t an issue, execution is.
4. Financials Overview
Q1 FY26 Snapshot:
- Revenue: ₹680 Cr (+18%)
- OPM: 89% (best-in-class)
- PAT: ₹220 Cr (+59%)
- EPS: ₹0.26
Verdict: Revenues rise, profits soar, but ROE is stuck under 4%.
5. Valuation – What’s This Stock Worth?
At P/E 162 and P/B 4.9, NGEL trades like a tech unicorn, not a PSU. Fair value using peers (Adani Green, JSW Energy) lands at ₹80–₹120. At current ₹107, it’s not cheap, but growth keeps the solar panels shining.
6. What-If Scenarios
- If capacity hits 60 GW: EPS rockets, stock rerates higher.
- If tariffs fall / costs rise: Margins evaporate.
- If debt balloons: Interest eats profits, P/E becomes a joke.
- If hydrogen bets pay off: Multi-bagger territory.
7. What’s Cooking (SWOT)
Strengths: Backing of NTPC, largest PSU RE player, strong PPAs.
Weaknesses: Low ROE, high leverage, no dividend.
Opportunities: Hydrogen, storage, 60 GW expansion.
Threats: Tariff cuts, policy shocks, rising interest costs.
8. Balance Sheet 💰
| ₹ Cr | FY23 | FY24 | FY25 |
|---|---|---|---|
| Equity | 4,720 | 5,720 | 8,426 |
| Reserves | 168 | 513 | 10,014 |
| Borrowings | 6,137 | 13,857 | 19,441 |
| Total Liabilities | 18,431 | 27,207 | 45,421 |
Capex-heavy, debt is rising faster than your EV charging bill.
9. Cash Flow (FY23–FY25)
| ₹ Cr | FY23 | FY24 | FY25 |
|---|---|---|---|
| Operating | 17 | 1,579 | 1,999 |
| Investing | -10,304 | -9,207 | -17,793 |
| Financing | 10,360 | 7,671 | 15,715 |
| Net Cash | 73 | 43 | -80 |
Cash flow screams: growth funded by debt.
10. Ratios – Sexy or Stressy?
| Metric | FY24 | FY25 |
|---|---|---|
| ROE (%) | 4 | 3.8 |
| ROCE (%) | 8 | 4.9 |
| OPM (%) | 89 | 87 |
| D/E | 2.4 | 2.3 |
Margins sexy, leverage stressy.
11. P&L Breakdown
| ₹ Cr | FY23 | FY24 | FY25 |
|---|---|---|---|
| Revenue | 170 | 1,963 | 2,210 |
| EBITDA | 152 | 1,748 | 1,916 |
| PAT | 171 | 345 | 474 |
Exponential revenue growth, but profits lag due to interest.
12. Peer Comparison
| Company | P/E | ROE% | OPM% | PAT Qtr Cr |
|---|---|---|---|---|
| NTPC Green | 162 | 3.8 | 89 | 220 |
| Adani Green | 88.5 | 14.6 | 77.6 | 824 |
| JSW Energy | 51 | 7.4 | 44.4 | 414 |
| NHPC | 28 | 7.7 | 53.1 | 919 |
NTPC Green is priced like a premium EV, delivering scooter-like ROE.
13. EduInvesting Verdict™
NGEL is the poster child of PSU renewables—huge potential, fat margins, and government backing. But at current valuations, investors are paying for 2032 dreams today.
A green giant in the making, but for now, the sun’s too hot for comfort.
Written by EduInvesting Team | 28 July 2025
Tags: NTPC Green Energy, Renewable Energy, Q1 FY26, Solar & Wind, EduInvesting Premium
