Neetu Yoshi FY26: 53% PAT Growth, 31% OPM, But Working Capital Just Tripled
General information and entertainment, not investment advice. The author is not a SEBI-registered adviser or research analyst. No recommendation, no promised returns. Markets carry risk including loss of capital. Figures may not be current. Consult a registered adviser before acting.
At a Glance
FY26 marked explosive profitability for a micro-cap foundry once known for raw material trading. Revenue hit ₹98.4 cr, up 39% year-on-year. Net profit landed at ₹25.0 cr—a 53% spike. The equity base swelled from ₹14.3 cr to ₹137.3 cr, inflated by an IPO that raised ₹77 cr (gross) and is still being deployed.
But spend three seconds on the working capital: receivables jumped from ₹10.4 cr to ₹31.9 cr, inventory dropped (good), and the total working capital days ballooned from 55 to 133—a near-doubling. Something shifted in customer mix or payment terms. The order book stands at ₹140+ cr, which is encouraging noise until execution hits.
The company is Class A RDSO-certified, supplies Indian Railways with 25+ components, and just spun up a second facility. Margins remain punchy at 31.1% OPM and 25.4% PAT. That’s the tension: impressive unit economics colliding with how much cash it now needs to keep the lights on.
Introduction
Neetu Yoshi started in 2020 as a trader in raw materials to railway original equipment manufacturers. By FY24, it had a small foundry. By FY26, it was listed on the BSE SME platform, had commissioned a second facility, and managed to triple its profit in three years despite the chaos of the pandemic and a capacity phase-out mid-cycle.
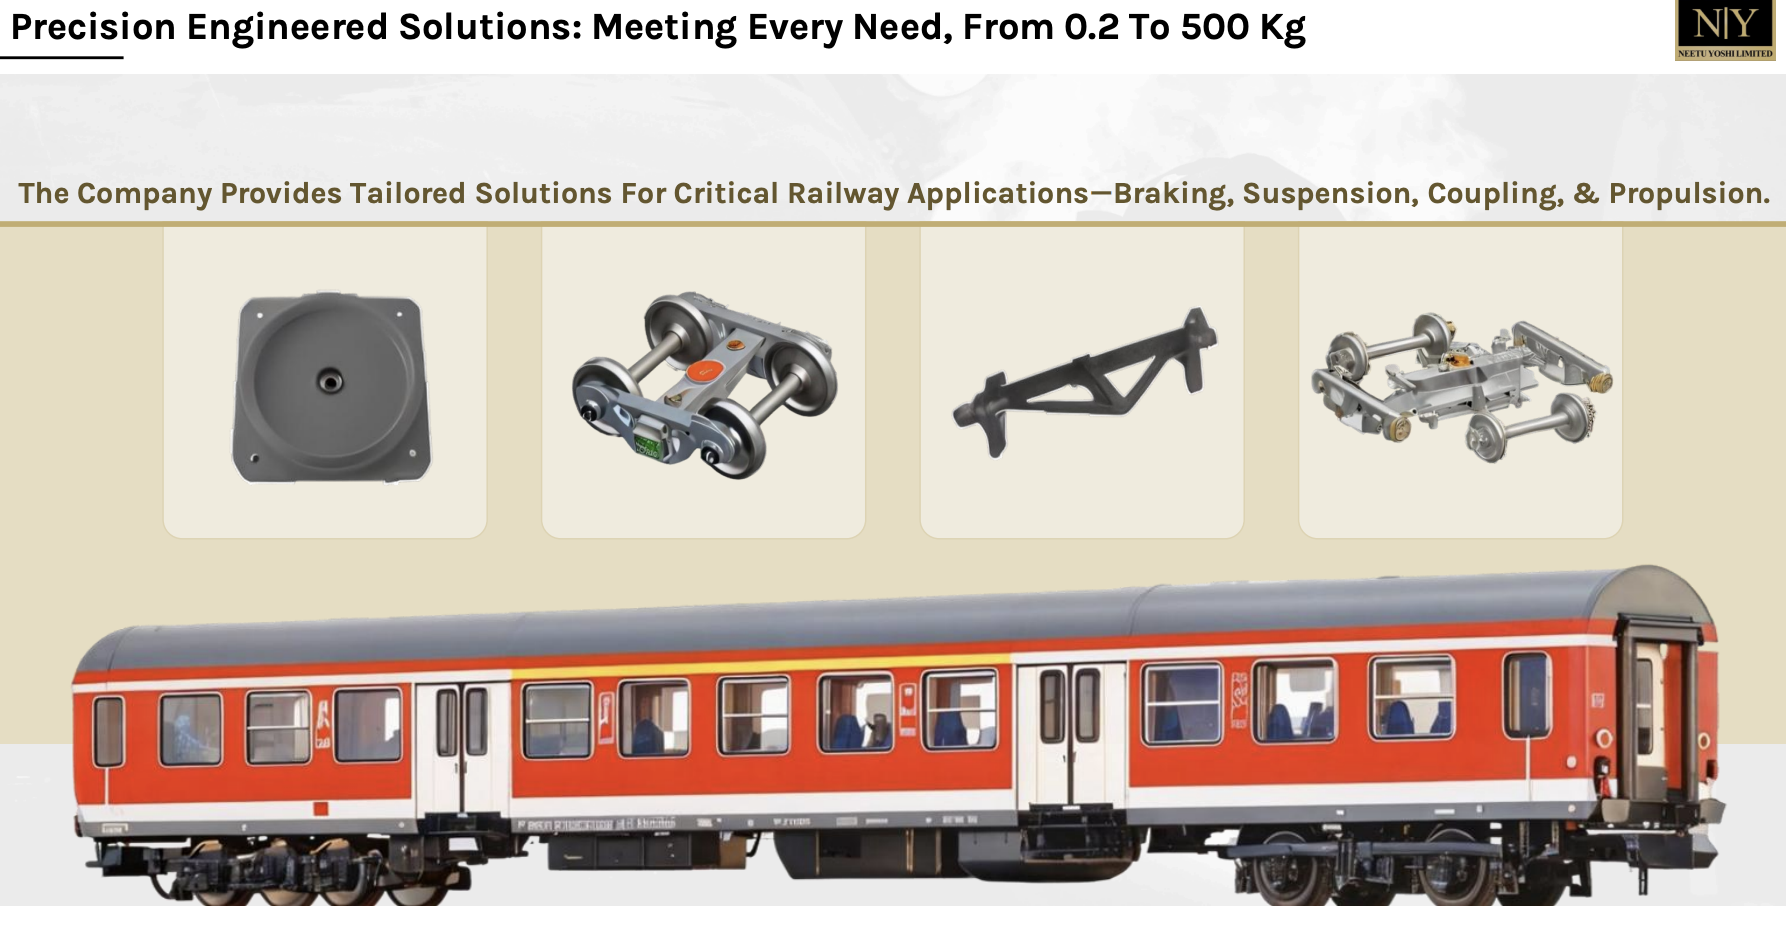
The business sells ferrous castings—cast iron, SG iron, manganese steel, mild steel—in weights from 200g to 500 kg to Indian Railways and allied wagon manufacturers. Think brake beams, bogies, suspension struts. RDSO approval is non-negotiable for Railways supply; Neetu Yoshi has it for 25 products and is pushing 15–20 more through the pipeline. The regulatory moat is real.
The IPO landed in July 2025. Founders Subodh Lohia (34% promoter stake) and Himanshu Lohia (also 34%) kept the company at 70% family ownership. FII holdings sit at 0.07%, DII at 3.91%, public at 26%. Since July, the stock has moved from ₹75 to ₹142.7 (12 Jun close, prices referenced are not live). Market cap ₹554 cr on 3.88 cr shares.
Business Model: WTF Do They Even Do?
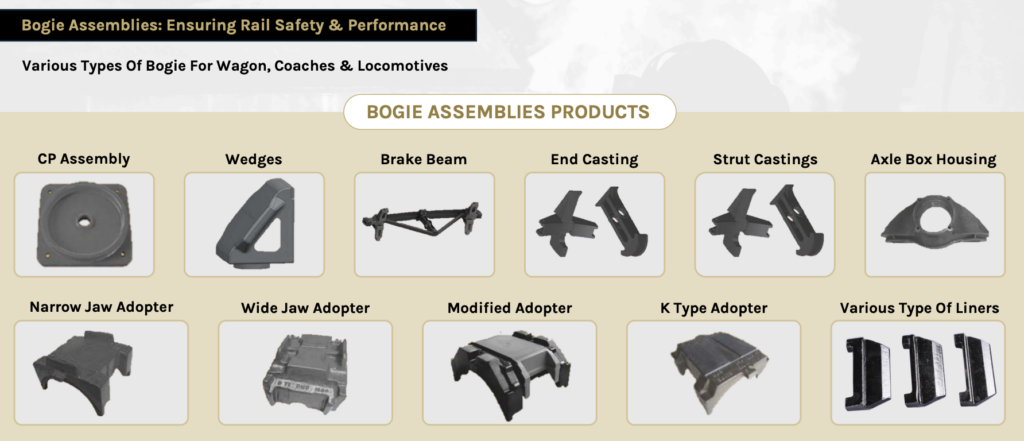
The company manufactures precision castings using arc and induction furnaces (up to 5 MT each), feeds them through CNC machines, and heat-treats at up to 1050°C. Products range across bogie assemblies (CP assemblies, wedges, brake beams), coupler systems (strikers, yokes, pins), and miscellaneous components used in suspension, braking, and propulsion.
The old facility sits in Bhagwanpur, Uttarakhand—a deliberate choice. Proximity to Jagdari Railway Workshop (72.6 km away), low electricity tariffs, and a semi-retired workforce made costs competitive. In 2023, they expanded the furnace capacity from 4.5k MTPA to 8.1k MTPA just by adding a third induction furnace. Then they hit a bottleneck: products heavier than 100 kg. Enter the second facility, commissioned in FY26 in Haridwar, designed to cast up to 1.5 tons.
The old plant was running at ~51% utilization (4,100 MT cast against 8,087 MT capacity). So either the furnaces were oversized for current demand, or the company kept powder dry for a ramp.
Revenue mix is relentlessly railways: FY25 was 99% railways, 1% other. By H2 FY26, private customers (wagon makers, component integrators) crept to 44% of half-yearly sales. Geographically, the company supplies across West Bengal, Jharkhand, Chhattisgarh, UP—states with active railway wagon and track manufacturing ecosystems.
The company roasts itself quietly: it’s a niche caster in a thin market. Approvals take 6–9 months per product. Competitors are often unlisted or overseas. And if you lose a product certification, you lose that revenue stream—no retail loyalty, no switching costs. Instead, it’s a game of scale, speed, and safety reputation.
Financials Overview
Figures are consolidated, in ₹ crore.
Yearly (FY24–FY26):
Metric
FY24
FY25
FY26
Revenue
47.3
70.6
98.4
EBITDA
17.2
23.4
33.9
PAT
12.6
16.4
25.0
EPS
₹3.24
₹0.58
₹6.45
Note: EPS comparison is distorted by a bonus issue and capital increase. FY25 EPS (₹0.58) used consolidated reported basis; FY26 EPS (₹6.45) is on ~3.88 cr adjusted shares post-IPO. Year-on-year growth is a cleaner lens.
Revenue climbed 39% YoY. Operating profit (EBITDA) expanded 45% YoY, outpacing sales. PAT spiked 53% YoY. Tax rate held at ~17% (a government scheme for qualifying manufacturers). The company recorded “other income” of ₹3.2 cr in FY26, mostly FDR interest from the IPO float; prior years had near-zero.
H1 FY26 vs H1 FY25:
Metric
H1 FY25
H1 FY26
YoY
Revenue
35.4
54.2
+53%
PAT
8.5
13.5
+59%
The second half of FY26 benefited from ramp-up in the new Haridwar facility. Management confirmed first invoices in June 2026. Guidance for FY27: ₹210–220 cr revenue, 25% PAT margin. At the midpoint (₹215 cr), that’s a 119% YoY push—aggressive, but paired with stated execution for old (₹110 cr capacity) plus new plant (₹100 cr FY27 target).
Concall color: management attributed sustained profitability to low/zero finance cost (debt repaid April 2026), tax arbitrage, and product-mix upgrades into higher-margin railway components. Receivables spiked due to Railways’ Feb–Mar budget exhaustion; April collections were “half” the March-end balance. Bogie prices fell ~18% (from ₹3.25 lakh to ₹2.70–2.80 lakh) due to wagon-cycle softness but are expected to recover.
Market Expectations & Historical Multiples
This section describes how the market is currently pricing the company and how that compares with its own history and peer group. It is descriptive, not predictive.
Metric
Current
Historical Average
Peer Median
P/E
22.1
19.1 (5-yr)
26.1 (Castings & Forgings)
EV/EBITDA
16.1
—
—
P/B
4.04
—
3.16
ROE
27.5%
38–40% (3–5 yr)
13.1%
ROCE
31.8%
44–64% (3–5 yr)
15.65%
The market currently pays 22x earnings here, sitting below the peer median of 26x. Book value multiples are also below peer mean (4.04 vs 3.16 median), a rare inversion. ROE at