Once a sleepy container handler in Panvel, Navkar Corporation Ltd has just been reborn — not as a logistics operator, but as JSW Infrastructure’s newest toy. Priced at ₹121, with a market cap of ₹1,818 crore and trading at 0.94× book value, the stock looks more like a “yard sale” find than a polished port asset.
But here’s the spicy bit: Q2FY26 saw revenues jump to ₹162 crore (up 19.5%) and profits multiply 437% QoQ. Yes, from being a loss-making logistics dinosaur in FY24 (₹-23 crore PAT), Navkar suddenly remembered how to handle containers and cash.
After JSW Port Logistics bought 70% for ₹1,012 crore, Navkar’s once-fading CFS/ICD empire is now part of a multi-port, multi-modal strategy. The JSW stamp means it’s no longer the underdog; it’s a vital cog in India’s largest private port-logistics empire — with an exciting three-year RPT pipeline with JSW Steel worth ₹725 crore.
Question: When a loss-making logistics firm gets adopted by a ₹2 trillion conglomerate, is it a turnaround story or just a port-side arranged marriage?
2. Introduction
Let’s be honest — Navkar Corporation used to be that forgotten cousin in India’s logistics family reunion. While Container Corporation and Blue Dart strutted around with fat margins and high valuations, Navkar sat in the corner counting TEUs (containers) and hoping someone noticed.
Then in mid-2024, the universe — or rather, JSW Infrastructure — decided to intervene. In June 2024, the Jindal group’s port subsidiary bought 70% of Navkar for ₹1,012 crore, effectively turning this CFS/ICD player into JSW’s logistics muscle.
The company’s past? A solid CFS setup near Nhava Sheva, some inland depots in Gujarat, and rail terminals that worked fine but never caught scale. It even sold its Tumb ICD to Adani for ₹831 crore in 2022, used the cash to pay debt, and… drifted.
The future? Now it’s part of JSW’s ₹30,000 crore capex dream to reach 400 MTPA port capacity by FY2030. The “CFS uncle” is suddenly in the big league — with access to steel cargo, export traffic, and capital discipline.
So yeah, from “Who cares?” to “JSW owns me now.” — that’s quite a fiscal glow-up.
3. Business Model – WTF Do They Even Do?
Navkar’s business model is basically “We move boxes. Very efficiently. Sometimes by train.”
Here’s how the layers stack up:
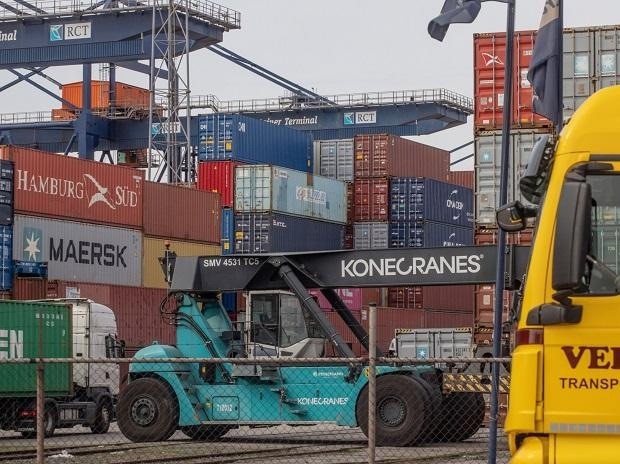
1️ Container Freight Stations (CFSs) – Three CFSs near Nhava Sheva Port, handling import/export cargo, warehousing, repair yards, and customs. The core business, still 68% of revenue.
2️ Inland Container Depot (ICD) – An inland hub near Morbi, Gujarat — tied into their Multimodal Logistics Park (MMLP). Offers bonded warehousing, domestic cargo handling, and rail access to ports. Still early stage but strategically gold because Morbi is India’s ceramics capital.
3️ Private Freight Terminals (PFTs) – Two PFTs (Somathane near Panvel, and Morbi) handling all kinds of trains — steel, automobiles, bulk, and containers.
4️ Container Train Operator (CTO) – With a Category 1 license from Indian Railways, Navkar operates 8 rakes pan-India. These are its logistical arteries, now expected to plug directly into JSW’s steel plants and port network.
Revenue Mix FY24:
Cargo Handling – 68%
Transportation – 30%
Others – 2%
Sarcastically speaking, Navkar doesn’t do anything “fancy.” It just owns big yards, bigger cranes, and a few trains. But under JSW, those boring assets might suddenly become “strategic national infrastructure.”
4. Financials Overview
Metric
Latest Qtr (Q2FY26)
YoY Qtr (Q2FY25)
Prev Qtr (Q1FY26)
YoY %
QoQ %
Revenue (₹ Cr)
162.4
135.9
138.5
19.5%
17.2%
EBITDA (₹ Cr)
24.4
17.5
20.5
39.4%
19.0%
PAT (₹ Cr)
4.35
2.11
2.45
106%
77.6%
EPS (₹)
0.29
0.14
0.16
—
—
From losses to profits, Navkar’s finally showing green boxes in Excel. The EBITDA margin climbed back to 15%, after hitting near zero in FY24. JSW’s freight integration magic seems to be working — or maybe the CFO just learned how to invoice JSW Steel properly.
5. Valuation Discussion – Fair Value Range
Let’s calculate, for educational kicks:
Method 1: Price-to-Book (P/BV)
Book Value: ₹129 Current P/B: 0.94× Peers (TCI, CONCOR) trade at 2.5–3.5× Fair Range = ₹155 – ₹190
Method 2: EV/EBITDA
EV = ₹1,984 Cr; EBITDA FY25 = ₹34 Cr → EV/EBITDA = 58× (ouch) Post-integration synergy, if EBITDA doubles to ₹70 Cr → EV/EBITDA ≈ 28× Fair EV Range = ₹1,200–₹1,500 Cr → ₹95–₹120 per share