National Fittings Ltd Q2 FY26 Results | From Grooved Pipes to Grooved Promoters – 119% Profit Surge, ₹13.5 Cr Land Sale Drama & Open Offer Saga at ₹135/share!
1. At a Glance
If your idea of “fitting” news involves pipes, promoters, and profits all twisting together like a plumbing meme, welcome to National Fittings Ltd’s Q2 FY26 carnival. The Coimbatore-based fittings manufacturer just dropped numbers that made even steel valves blush — Revenue ₹23.6 Cr, PAT ₹1.84 Cr, and YoY profit growth a jaw-dropping 119%.
At a market cap of ₹141 Cr, the company trades around ₹155, with a P/E of 15.6, and a Book Value of ₹93.1, making it one of those “small-cap ka sasta jugaad” stories that could either turn gold or rust depending on management’s next weld.
Add to that the recent open offer drama: Promoter group sold 34.04% to Himgiri Castings Pvt Ltd, triggering a mandatory open offer at ₹135/share, and boom — corporate India got a spicy subplot. Meanwhile, they also offloaded land worth ₹13.5 Cr at Dindigul and a factory for ₹28 Cr earlier in FY25. Because when fittings don’t fit, you liquidate your land, right?
Return on Equity stands at 9.12%, ROCE at 10%, and the Dividend Yield at 0.64% — not mind-blowing, but hey, for a company that exports pipes to the Middle East and profits to shareholders, it’s not a bad plot twist.
2. Introduction
National Fittings Ltd — founded in 1993 — could easily headline a Netflix show titled “Pipes, Profits & Promoters.” The company’s journey reads like a Tamil industrial thriller where foundries, castings, and corporate drama mix with investor confusion.
This quarter, they’ve pulled off what few smallcaps manage — a profit jump of 119% YoY, thanks partly to tighter expense control and probably the divine grace of stainless steel. And while sales grew a modest 26.6%, it’s the clean balance sheet, Debt-to-Equity ratio of 0.04, and interest coverage of 17.9x that give this company its “old-school conservative accountant” vibe.
Of course, not everything’s shiny chrome. Promoter holding is just 34%, and that too has changed hands recently — hello, Himgiri Castings. Meanwhile, the public holds nearly 66%, meaning every quarterly result becomes a mini referendum on faith in metal.
And yes, the company has a healthy dividend payout history (around 19.4%), so if you like your investments to at least pay you while you wait for growth, National Fittings might just fit the bill — or the flange.
3. Business Model – WTF Do They Even Do?
Let’s decode the business before we start admiring its fittings like fine jewellery.
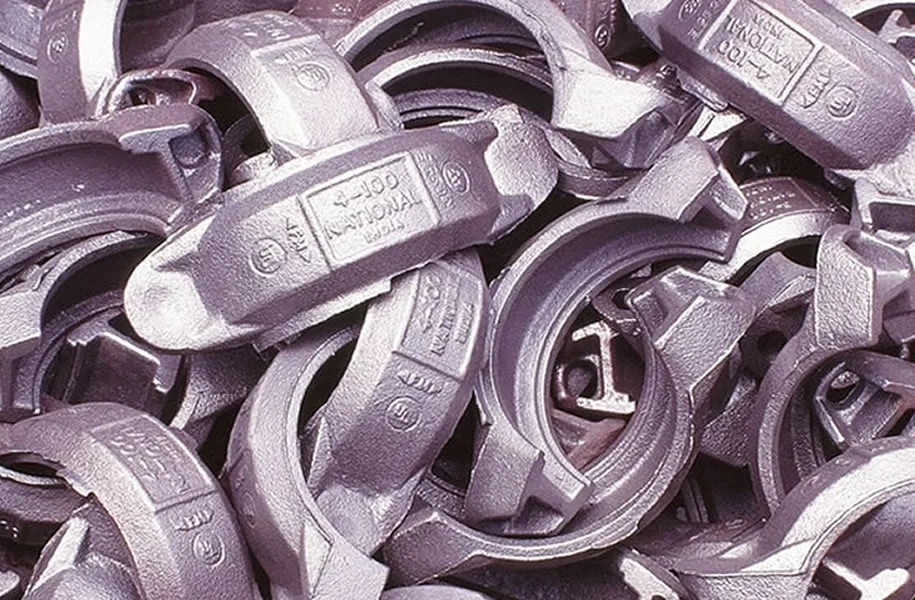
National Fittings makes spheroidal graphite (SG) iron pipe fittings, stainless steel fittings, and stainless steel ball valves — essentially the joints, valves, and connectors that make plumbing systems, industrial plants, and infrastructure function. Think of them as the “connective tissue” of metal infrastructure — invisible but vital.
Their product zoo includes:
Grooved Piped Fittings – ductile iron and stainless steel variants.
Screwed Pipe Fittings – for socket weld and threaded connections.
Valves – ball, butterfly, and check valves.
Pumps – a mini empire of centrifugal, booster, submersible, and vacuum pumps.
In short: if it moves fluid, National Fittings probably made a part of it.
The company also operates multiple foundries, including a lost-wax investment casting facility, which is as fancy as it sounds — molten metal art with engineering purpose. And yes, they’re ISO 9001 certified, which is basically the corporate equivalent of saying, “Mom, look, I’m a serious company.”
Their exports go to the Middle East (67%), while domestic sales account for 33%. That’s right — this Coimbatore-based player ships fittings from Tamil Nadu to Texas, literally turning rust into foreign exchange.
4. Financials Overview
Let’s talk numbers — because even in a world of pipes and valves, money still needs to flow.
Quarterly Comparison Table (₹ Cr)
Metric
Sep FY26 (Latest Qtr)
Sep FY25 (YoY)
Jun FY26 (QoQ)
YoY %
QoQ %
Revenue
23.64
18.68
20.58
26.6%
14.8%
EBITDA
2.44
1.39
3.57
75.5%
-31.7%
PAT
1.84
0.84
2.62
119%
-29.8%
EPS (₹)
2.03
0.92
2.88
120.6%
-29.5%
So yes, QoQ profit dipped slightly, but YoY numbers? Absolute glow-up.
Annualised EPS = 2.03 × 4 = ₹8.12 At a CMP of ₹155, that’s a P/E of ~19x on