1. At a Glance
National Fittings dropped a Q1 FY26 profit of ₹2.62 Cr, a 555% YoY jump, boosted by strong operations and an exceptional ₹41.5 Cr asset sale. Sales held at ₹20.6 Cr with OPM 17.3%, margins rising like their ball valves. Stock at ₹164 trades at 18.6x P/E, still under radar.
2. Introduction
What happens when a small-cap foundry starts acting like a cash machine? You get National Fittings Q1 FY26: steady sales, improved margins, and a balance sheet bulked by one-time gains. Behind the numbers, the export engine to the Middle East & US is warming up.
3. Business Model (WTF Do They Even Do?)
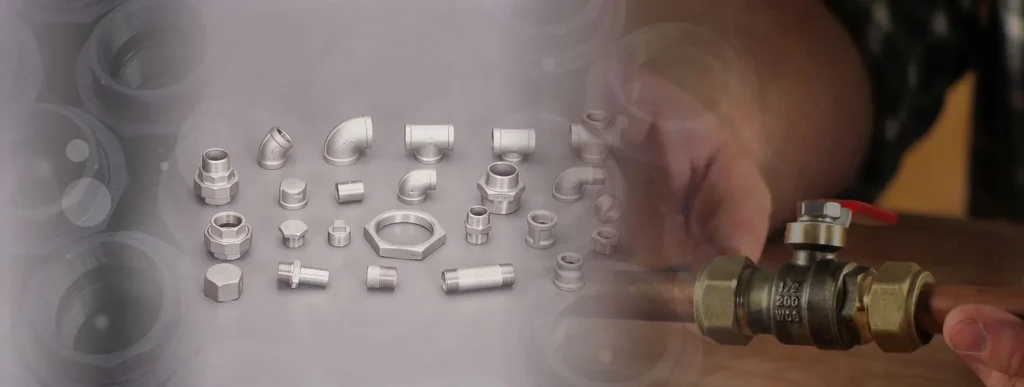
They manufacture spheroidal graphite and stainless-steel pipe fittings, valves, and pumps. Their USP:
- Export-oriented ISO 9001 plant.
- Lost wax casting tech, integrated foundry.
- Customers in USA, Europe, South America, Australia.
They are basically the plumber to the global industrial giants.
4. Financials Overview
| Metric | Q1 FY26 | Q1 FY25 |
|---|---|---|
| Revenue | ₹20.6 Cr | ₹15.1 Cr |
| Operating Profit | ₹3.57 Cr | ₹0.91 Cr |
| OPM % | 17.3% | 6% |
| Net Profit | ₹2.62 Cr | ₹0.4 Cr |
| EPS | ₹2.88 | ₹0.92 |
Margins tripled, profits exploded. For once, not due to accounting wizardry.
5. Valuation – What’s This Stock Worth?
- CMP ₹164, P/E 18.6x (reasonable).
- Book Value ₹89 → P/BV 1.84x.
- EV/EBITDA attractive given cash boost.
Fair Value Range: ₹150–₹200 based on core earnings; asset sale is a bonus but not recurring.
6. What-If Scenarios
- Bull Case: Exports scale, OPM >15% sustained → stock rerates to ₹200+.
- Bear Case: Asset sale one-off, margins normalize → ₹140 floor.
- Base Case: EPS grows in low double digits → ₹170–₹180.
7. What’s Cooking (SWOT Analysis)
Strengths:
- Debt-free, strong cash flows.
- 36% profit CAGR over 5 years.
- Healthy dividend history.
Weaknesses:
- Sales growth sluggish (5-year CAGR 7%).
- Low promoter holding (34%).
Opportunities:
- Growing export orders.
- Cost efficiency via integrated foundry.
Threats:
- Global steel price volatility.
- Low pricing power in commodity fittings.
8. Balance Sheet 💰
| Item | FY25 |
|---|---|
| Equity Capital | ₹9 Cr |
| Reserves | ₹72 Cr |
| Borrowings | ₹5 Cr |
| Total Assets | ₹103 Cr |
Minimal debt, strong reserves—solid footing.
9. Cash Flow (FY25)
- Ops: ₹8 Cr positive.
- Investing: +₹37 Cr (asset sale proceeds).
- Financing: –₹12 Cr (dividends, debt repayments).
Cash is gushing, thanks to asset sale.
10. Ratios – Sexy or Stressy?
| Ratio | Value |
|---|---|
| ROE | 8.9% |
| ROCE | 9.8% |
| P/E | 18.6x |
| D/E | 0.05 |
| PAT Margin | 13% (Q1) |
ROE is decent, ROCE needs a push, but OPM revival is sexy.
11. P&L Breakdown – Show Me the Money
| Year | Revenue (₹ Cr) | OPM % | PAT (₹ Cr) |
|---|---|---|---|
| FY23 | 86 | 11% | 4 |
| FY24 | 77 | 15% | 6 |
| FY25 | 78 | 10% | 23 (asset sale) |
| Q1 FY26 | 20.6 | 17% | 2.6 |
Margins rebounding sharply post FY25.
12. Peer Comparison
| Company | P/E | OPM % | ROE |
|---|---|---|---|
| APL Apollo | 52x | 6% | 19% |
| Welspun Corp | 19x | 12% | 18% |
| Jindal Saw | 9x | 17% | 14% |
| National Fittings | 19x | 17% | 9% |
Trades at modest multiples with high margins.
13. EduInvesting Verdict™
National Fittings is quietly compounding with export-led growth and a healthy balance sheet. Q1’s asset sale distorts the picture, but core margins >15% are encouraging.
Final Word: A steady dividend-paying stock with occasional fireworks. Not a rocket, but a well-oiled valve.
Written by EduInvesting Team | 28 July 2025
Tags: National Fittings, Industrial Fittings, Q1 FY26 Results, EduInvesting Premium