1. At a Glance
NACL Industries turned its Q1 FY26 into a redemption arc – Revenue ₹448 Cr (+38% YoY), PAT ₹13 Cr (after several loss-making quarters), and OPM rebounded to 8%. But with ROE still at -26%, the market at ₹279 (P/B 13.2) is betting on Coromandel’s magic wand.
2. Introduction
Think of a farmer who finally gets rain after two drought years – that’s NACL’s Q1. After a rough FY24–25 with negative profits, Q1 shows green shoots. But the soil (balance sheet) still has toxic debt and weak returns.
3. Business Model (WTF Do They Even Do?)
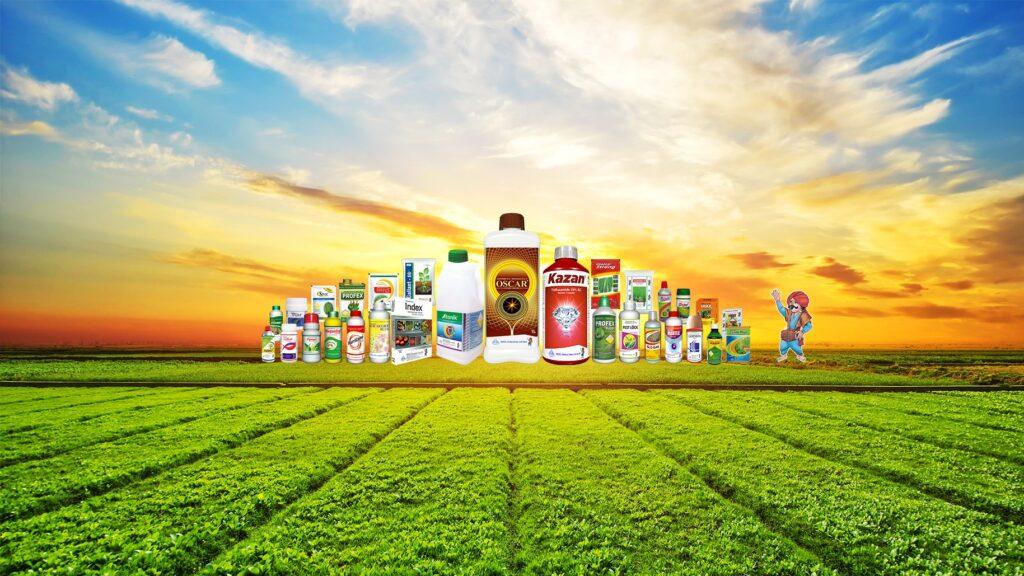
NACL makes and trades agrochemicals – technicals, formulations, and contract manufacturing for global MNCs. They sell across 55,000 retail counters in India, export to 30+ countries, and are now expanding brand presence in Africa and SE Asia. Essentially, they mix chemicals, ship them, and hope farmers love them.
4. Financials Overview
Q1 FY26 Snapshot:
- Revenue: ₹448 Cr (+38% YoY)
- Operating Profit: ₹38 Cr (OPM 8%)
- PAT: ₹13 Cr (vs loss of ₹50 Cr in Q4 FY25)
- EPS: ₹0.65
Verdict: Good quarter, but one swallow doesn’t make a spring.
5. Valuation – What’s This Stock Worth?
With losses in FY25, P/E is meaningless. At P/B 13, the market is pricing in a Coromandel turnaround. A fair value (if margins stabilize at 10% and profits at ₹60 Cr FY26E) is ₹180–₹220. Anything above is hope premium.
6. What-If Scenarios
- If Coromandel integration succeeds: Cost synergies, profits bounce, stock >₹300.
- If turnaround stalls: Margins stay weak, stock sinks <₹200.
- If global crop prices surge: Revenue rises but debt may choke.
- If raw material volatility returns: Back to losses.
7. What’s Cooking (SWOT Analysis)
Strengths: Strong distribution, MNC contracts, parent backing.
Weaknesses: Recent losses, low margins, high working capital.
Opportunities: Coromandel stake, restructuring, exports.
Threats: Agrochemical demand cycles, regulatory bans, FX risk.
8. Balance Sheet 💰
| ₹ Cr | FY23 | FY24 | FY25 |
|---|---|---|---|
| Assets | 1,914 | 1,818 | 1,263 |
| Net Worth | 574 | 511 | 427 |
| Debt | 724 | 789 | 399 |
| Liabilities | 616 | 518 | 437 |
Debt fell in FY25, but reserves eroded due to losses.
9. Cash Flow (FY23–FY25)
| ₹ Cr | FY23 | FY24 | FY25 |
|---|---|---|---|
| Ops | -20 | 50 | 469 |
| Investing | -143 | -38 | 4 |
| Financing | 134 | -22 | -448 |
| Net Cash | -28 | -9 | 25 |
FY25 operating cash positive (₹469 Cr) – rare good news.
10. Ratios – Sexy or Stressy?
| Ratio | FY23 | FY24 | FY25 |
|---|---|---|---|
| ROE (%) | 15 | -26 | -26 |
| ROCE (%) | 15 | 0 | -8 |
| PAT Margin (%) | 4.5 | -3.3 | -4.3 |
| D/E | 1.4 | 1.5 | 0.9 |
Numbers scream: “still stressed.”
11. P&L Breakdown – Show Me the Money
| ₹ Cr | FY23 | FY24 | FY25 |
|---|---|---|---|
| Revenue | 2,116 | 1,779 | 1,235 |
| EBITDA | 193 | 17 | -63 |
| PAT | 95 | -59 | -92 |
FY25 was a disaster, Q1 FY26 is the comeback teaser.
12. Peer Comparison
| Company | P/E | ROE% | OPM% | PAT Qtr Cr |
|---|---|---|---|---|
| NACL Industries | N/A | -26 | 8 | 13 |
| PI Industries | 37.5 | 17.6 | 27.6 | 330 |
| Dhanuka Agritech | 27.2 | 22 | 20.4 | 75.5 |
| Rallis India | 41.1 | 6.7 | 11.9 | 95 |
Peers have higher margins and ROE, NACL is still the problem child.
13. EduInvesting Verdict™
NACL Industries is staging a recovery, but with negative ROE, thin margins, and valuation premium baked in due to Coromandel’s 53% stake, it’s a high-risk turnaround play.
For now, it’s a seedling – either it grows into a tree or withers under market heat.
Written by EduInvesting Team | 28 July 2025
Tags: NACL Industries, Q1 FY26, Agrochemicals, Turnaround Story, EduInvesting Premium

