1. At a Glance
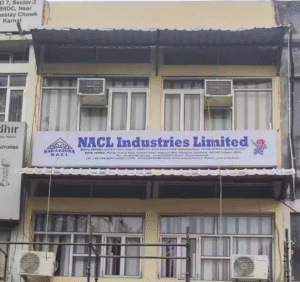
NACL Industries is that agrochemical company which sells insecticides, fungicides, and herbicides — basically stuff farmers spray on fields so crops survive. Ironically, the same chemicals that kill pests have now started eating into NACL’s own balance sheet. With₹1,358 Cr sales in FY25but anet loss of ₹88 Cr, the company is in the awkward spot of making plants healthier while investors lose sleep. Recently, Coromandel International swooped in and bought53% stake, turning this from a family-run pesticide story into a proper corporate M&A drama.
2. Introduction
If the IT industry sells “PowerPoint decks,” the agrochemicals industry sells “magic potions in bottles.” Farmers buy them hoping their crops won’t be eaten alive, and investors buy agrochemical stocks hoping their portfolios won’t be. NACL has been around for decades, exporting to 30+ countries, supplying 50+ products, and covering all the major crop categories.
But here’s the twist — despite presence in55,000+ retail countersand 518 product registrations in India, NACL’s margins are more volatile than Indian monsoons. FY24 was a washout with global agrochemical glut, price crashes, and excess Chinese supply. FY25? Another rough patch: sales revived in Q1 FY26 (+38% YoY), but overall profitability is missing like the government’s MSP payment deadlines.
Now withCoromandel International (Murugappa Group)taking control, investors are asking: will NACL finally turn around, or will it remain the “Rallis India of Vizag”?
3. Business Model (WTF Do They Even Do?)
Three-legged stool:
- Domestic Retail– Sell insecticides, fungicides, herbicides, and PGRs directly to farmers across India. Farmers know brand names likeRozzer, Rhino, Gallant Gold, Surya(sounds more like WWE wrestlers than agrochemicals).
- Domestic Institutional– Supply technicals and bulk formulations to other agro companies. Think of it as B2B pesticides.
- Exports– Ship both technicals and formulations to MNCs across 30+ countries. Currently 22% of revenue comes from exports.
Product Split FY24:
- Insecticides – 48%
- Herbicides – 21%
- Fungicides – 19%
- PGR & Others – 12%
So basically, half the company sprays bugs, a fifth sprays weeds, a fifth sprays fungus, and the rest sprays “hope.”
4. Financials Overview
Q1 FY26 vs Q1 FY25 vs Q4 FY25
| Metric | Jun ’25 | Jun ’24 | Mar ’25 | YoY % | QoQ % |
|---|---|---|---|---|---|
| Revenue | ₹448 Cr | ₹325 Cr | ₹201 Cr | +38% | +123% |
| EBITDA | ₹38 Cr | -₹4 Cr | -₹74 Cr | Big swing | Big swing |
| PAT | ₹13 Cr | -₹21 Cr | -₹50 Cr | +163% | Back to profit |
| EPS (₹) | 0.65 | -1.04 | -2.49 | N/A | N/A |
Annualised EPS (based on latest quarter) = ₹0.65 × 4 = ₹2.6At CMP ₹245 → P/E = ~94x (but trailing EPS is negative,
so technically “P/E not meaningful”).
Commentary: Q1 profit is back, but full-year losses still loom like weeds in a paddy field.
5. Valuation (Fair Value RANGE only)
Method 1: P/E
- Forward EPS guess: ₹5 (optimistic FY26 recovery).
- Assign P/E 20–25x (industry peers trade at 25–40x).
- FV = ₹100 – ₹125
Method 2: EV/EBITDA
- TTM EBITDA = -₹21 Cr (negative, so LOL).
- Assume FY26 EBITDA = ₹150 Cr (turnaround scenario).
- Apply 8–10x → FV = ₹1,200 – ₹1,500 Cr EV → Per share ₹60 – ₹75
Method 3: DCF (assuming recovery)
- OCF avg = ₹150 Cr, growth 8%, discount 12%
- FV range = ₹2,500 – ₹3,200 Cr → ₹125 – ₹160/share
👉Consolidated FV Range = ₹60 – ₹160(For education only, not investment advice.)
6. What’s Cooking – News, Triggers, Drama
- Coromandel Acquisition: In Aug ’25, Murugappa-backed Coromandel International bought 53% stake + open offer for 26% more at ₹76.7/share. Stock is now at ₹245 (3x that). Whoever sold at ₹76 must be crying louder than farmers during drought.
- Board Shake-up: New CEO, new directors, new auditors — basically, “Ctrl+Alt+Del” on corporate governance.
- Capacity Expansion: Brownfield (Srikakulam plant going from 17k TPA → 25k TPA), Greenfield (Multichem subsidiary → 38k TPA). If all goes well, they’ll drown India in pesticides.
- Exports Push: Targeting Southeast Asia & Africa with branded formulations. Because pests don’t need passports.
7. Balance Sheet
| Metric | FY23 | FY24 | FY25 |
|---|---|---|---|
| Assets | ₹1,914 Cr | ₹1,818 Cr | ₹1,263 Cr |
| Liabilities | ₹1,360 Cr | ₹1,307 Cr | ₹834 Cr |
| Net Worth | ₹574 Cr | ₹511 Cr | ₹427 Cr |
| Debt | ₹724 Cr | ₹789 Cr | ₹399 Cr |

