At a Glance
MSP Steel & Power somehow posted a profit of ₹18 Cr in Q1 FY26 after being in and out of the ICU for years. Sales dropped 7.9% YoY to ₹711 Cr, but operating margins held at a modest 6%. While this sounds like good news, don’t uncork the champagne yet – the company has an ROE of -3.7%, and 81.3% of promoter holding is pledged. This isn’t a turnaround story, it’s a survival reality show.
Introduction
You remember that one friend who always said he’s going to the gym but never really got in shape? That’s MSP Steel. For over a decade, it’s promised recovery, de-leveraging, margin expansion, and better operational performance – but always falls short.
Despite being in the cyclical but hot “steel & infra” space, MSP’s historical baggage of debt, losses, and promoter pledges keeps haunting its stock like a clingy ghost.
Business Model (WTF Do They Even Do?)
MSP Steel & Power is into:
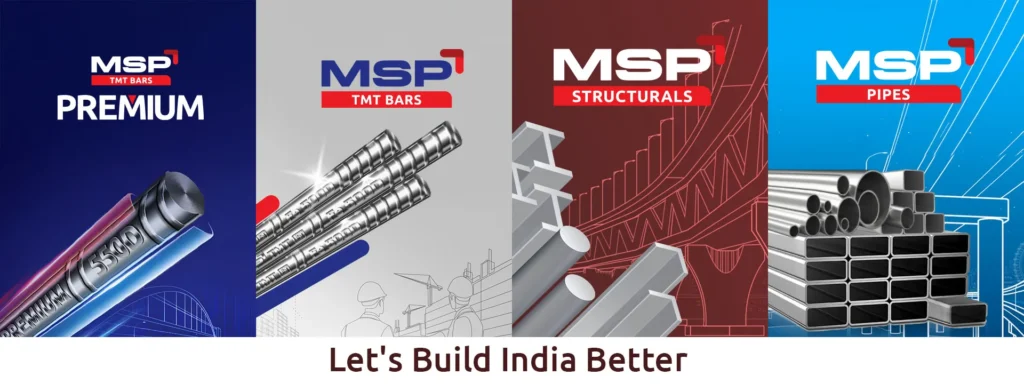
- Manufacturing: Sponge iron, billets, construction bars, structural steel.
- Rolling Mills & Power Generation: It even makes its own power, because why not?
- Trading: Sells steel products in domestic markets.
The product portfolio isn’t differentiated – it’s commoditized. So margins are thin, and scale is everything. Unfortunately, MSP’s scale isn’t big enough to throw elbows with giants like JSW or Tata Steel.
Financials Overview
Let’s not sugarcoat it. The numbers are… tolerable at best.
- Q1 FY26 Revenue: ₹711 Cr (↓7.9% YoY)
- Q1 PAT: ₹18 Cr (vs loss ₹2 Cr YoY)
- FY25 Revenue: ₹2,905 Cr
- FY25 PAT: ₹-28 Cr (yep, loss)
- OPM: 6% (barely makes the cut)
- ROCE: 6.4%, ROE: -3.7%
Verdict: This quarter shows signs of life, but long-term track record is a horror show.
Valuation – Bargain or Value Trap?
- P/E Multiple
- Company is loss-making (FY25), so P/E not meaningful
- Q1 FY26 annualized EPS: ₹1.2
- At CMP ₹31.4 → Trailing P/E ≈ 26
- EV/EBITDA
- FY25 EBITDA: ₹134 Cr
- EV ≈ ₹1,781 Cr (market cap, negligible cash)
- EV/EBITDA ≈ 13.2×
- Book Value
- BVPS: ₹17.3 → Price/BV = 1.82×
🎯 Fair Value Estimate: ₹20–25 range based on turnaround optimism. CMP ₹31 is pricing in a miracle. Again.
What’s Cooking – News, Triggers, Drama
- Q1 FY26 Profit: Back in the black after Q4 loss of ₹34 Cr
- Debt Reduction: Borrowings down from ₹813 Cr to ₹262 Cr – the only thing impressive here
- Audit Appointments: Secretarial, cost, and internal auditors appointed
- Promoter Drama: Still 81.3% of promoter holding is pledged – a full-blown trust issue
Balance Sheet – Auditor’s Roast
| (₹ Cr) | Mar 23 | Mar 24 | Mar 25 |
|---|---|---|---|
| Assets | 1,648 | 1,638 | 1,535 |
| Liabilities | 1,495 | 1,472 | 1,123 |
| Net Worth | 153 | 166 | 412 |
| Borrowings | 832 | 813 | 262 |
Commentary: Debt drop from ₹813 Cr to ₹262 Cr in FY25 is commendable. But the big question: was it actual repayment or asset sale/dilution?
Cash Flow – Sab Number Game Hai
| (₹ Cr) | FY23 | FY24 | FY25 |
|---|---|---|---|
| Ops | 86 | 170 | 189 |
| Investing | -19 | -50 | -34 |
| Financing | -104 | -106 | -178 |
Commentary: Strong operational cash flows in FY25 helped reduce debt. That’s the good news. The bad? You’re still stuck with a business that hasn’t grown topline in 2 years.
Ratios – Sexy or Stressy?
| Metric | Value |
|---|---|
| ROE | -3.7% |
| ROCE | 6.43% |
| D/E | 0.64 |
| OPM | 5% |
| P/B | 1.82 |
Commentary: ROE still negative. D/E has improved, but unless earnings follow suit, it’s lipstick on a pig.
P&L Breakdown – Show Me the Money
| (₹ Cr) | FY23 | FY24 | FY25 |
|---|---|---|---|
| Revenue | 2,550 | 2,874 | 2,905 |
| EBITDA | 64 | 125 | 134 |
| PAT | -51 | 14 | -28 |
Commentary: Revenue stagnation. Profits? See-saw. Definitely not what you’d expect in a steel supercycle.
Peer Comparison
| Company | Rev (₹ Cr) | PAT (₹ Cr) | ROE (%) | P/E |
|---|---|---|---|---|
| MSP Steel | 2,844 | -17 | -3.7 | NA |
| Jindal Saw | 20,829 | 1,473 | 13.7 | 9.26 |
| Shyam Metalics | 15,945 | 922 | 8.9 | 29.9 |
| APL Apollo Tubes | 20,885 | 801 | 19.4 | 54.2 |
Commentary: MSP is a midget in a room full of Olympic weightlifters. ROE is negative, P/E can’t be calculated. It’s the weakest link.
Miscellaneous – Shareholding, Promoters
Promoters hold just 35.24% – and a terrifying 81.3% of that is pledged. That means less than 7% clean holding. FIIs and DIIs combined own ~17%, with retail holding 47.87%. Trust deficit remains the core concern.
EduInvesting Verdict™
MSP Steel is a textbook case of “how not to run a steel company.” The Q1 FY26 profit is nice, but in isolation, it doesn’t erase years of erratic financials, promoter pledging, and trust erosion. Unless management commits to sustained profitability, margin expansion, and transparency, this stock remains speculative.
Strengths:
- Debt reduction a rare positive
- Margins showing signs of recovery
- Operational cash flows improving
Weaknesses:
- Negative ROE, erratic profits
- High promoter pledge
- No pricing power in product
Opportunities:
- Infra and steel demand tailwinds
- If debt remains low and profit grows, rerating possible
- Capex cycle benefits in 2026–27
Threats:
- Steel price volatility
- Raw material cost inflation
- Shareholding structure risk (pledge-triggered sell-offs)
Final Take:
If you’re a deep-value daredevil, MSP is your steel-flavored lottery ticket. For everyone else, this is best watched from a safe distance – with popcorn and limited capital exposure.
Written by EduInvesting Team | 30 July 2025SEO Tags: MSP Steel, Steel Stocks India, Q1 FY26 Results, Smallcap Metal Stocks


