Search for Stocks /

Modern Threads (I) FY26: A ₹193 Cr One-Off, A Repeat Audit Flag, And Yarn That Finally Turned A Real Profit

Spotted a factual error — a wrong number, date, or fact? Tell us and we will check the source.

General information and entertainment, not investment advice. The author is not a SEBI-registered adviser or research analyst. No recommendation, no promised returns. Markets carry risk including loss of capital. Figures may not be current. Consult a registered adviser before acting.

1. At a Glance

Modern Threads (I) Ltd closed FY26 with sales of ₹300.58 Cr and net profit of ₹13.04 Cr — a figure that reads like recovery until you notice ₹11.69 Cr of it is other income, not yarn. The operating business earned roughly ₹14 Cr; the rest arrived from elsewhere. Profit grew from ₹3.37 Cr the prior year, a jump that looks heroic on a percentage basis and modest in rupees.

The company carries a market cap of ₹163 Cr, a promoter holding of 65.16%, and reserves that spent most of the last decade underwater before turning positive in FY23. The audit opinion on these results is qualified — and has been, repetitively, for years.

Inventory sits at 217 days. The market pays 12.5x earnings here while the textile peer set trades near 24x. Two numbers, one question hanging between them.

The tension for the reader: a company that survived its own balance sheet, now growing again, still filing results its own auditor won’t sign clean.

2. Introduction

Incorporated in 1973, Modern Threads is the listed vehicle of the Modern Group, manufacturing worsted yarn, wool tops and synthetic yarn out of Bhilwara, Rajasthan. It exports to 25-plus countries across Europe, Latin America, the Far East, the Middle East and Africa.

The more interesting biography is financial. For years the balance sheet showed reserves of negative ₹150–200 Cr and borrowings near ₹193 Cr — the profile of a company that had been through the wringer of India’s old sick-industrial machinery, with share application money of ₹14.5 Cr raised under a BIFR restructuring scheme still sitting as refundable. Then FY23 arrived: borrowings collapsed from ₹191.76 Cr to ₹2.26 Cr, and reserves flipped from negative ₹145.7 Cr to positive ₹68.58 Cr in a single year.

Recent housekeeping has been steady rather than dramatic. In January 2026 Prabodh K. Nahar was appointed Executive Director and CFO, with Ram A. Kabra resigning the same day. A wholly owned UK subsidiary, Modern Woollens UK Limited, began operating in the December 2025 quarter. The FY26 audited results were approved by the board on 30 May 2026.

3. Business Model: WTF Do They Even Do?

They spin wool. Specifically: 100% wool raw-white and top-dyed yarn, speciality yarn, Australian merino re-combed wool tops from 17 to 25 micron, and polyester/wool blended tops. Then, because a wool business generates by-products the way a kitchen generates smell, they also sell lanolin (alcohol, wax, oil, ethoxylated, anhydrous), wool grease, and wool noil and spinning waste.

That last category is the tell of an operator squeezing every fibre. Noil — the short stuff combing leaves behind — gets sold as an input for woollen cloth rather than swept up. Nothing is wasted, which is admirable in a mill and telling in a company that has spent decades counting rupees carefully.

The FY23 disclosed mix ran Woollen ~67%, Yarn ~33%, with exports ~44% and domestic ~56%, and product sales making up ~98% of revenue against ~2% export incentives. Management now recognises the whole operation as a single textile-manufacturing segment, so the segment table has quietly disappeared into one line — convenient, though it does mean the outside reader can no longer see which fibre is pulling the weight.

Reader question: when a company folds two segments into one “sole segment,” does clarity improve, or just the number of tables you have to reconcile?

4. Financials Overview

Figures are standalone, in ₹ crore. The subsidiary began operating only in the December 2025 quarter and the auditor notes it is not material to the group; the standalone view carries the story.

MetricLatest Q (Mar 2026)YoY (Mar 2025)QoQ (Dec 2025)
Revenue78.1467.4174.90
Operating Profit5.200.856.51
PAT4.413.026.00
EPS (₹)1.270.871.73

The March quarter grew revenue 15.9% over the prior-year quarter and operating profit swung from ₹0.85 Cr to ₹5.20 Cr. Sequentially, though, PAT fell from ₹6.00 Cr to ₹4.41 Cr and operating profit slipped — the December quarter simply ran a leaner cost line. Other income of ₹3.75 Cr in the March quarter did much of the heavy lifting on the bottom line.

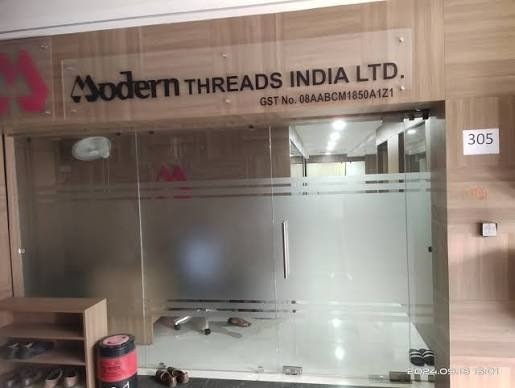
The audited FY26 results were approved on 30 May 2026 with a qualified opinion.

5. Market Expectations & Historical Multiples

This section describes how the market is currently pricing the company and how that compares with its own history and peer group. It is descriptive, not predictive.

MetricCurrentHistorical AveragePeer Median
P/E12.524.5
EV/EBITDA7.3
P/B1.1
ROE9.35%10.2% (3-yr)
ROCE12.8%9.0%

The market currently pays 12.5x earnings here versus a peer median near 24.5x and an industry P/E of 24.7. On book, it pays about 1.1x a net worth of ₹146.3 Cr.

What the multiple appears to be pricing is a business whose FY26 profit leans on ₹11.69 Cr of other income against roughly ₹14 Cr of operating profit, whose audit opinion is qualified year after year, and whose inventory sits at 217 days. Against that, ROCE recovered to 12.8% and sits above the peer median of 9.0%. The market, in other words, is applying a discount to a recovering operator with an asterisk stapled to its accounts.

One factual observation on expectations: the gap between a 12.5x multiple and a 24.5x peer median is wide enough that the market is clearly not treating this ₹300 Cr revenue line the way it treats the ₹2,000 Cr-plus mills beside it.

6. What’s Cooking

Real events from the filings, no manufacturing:

The FY26 board meeting on 30 May 2026 approved the audited results and reappointed S. Goyal & Co. as cost auditor for FY27. Modern Woollens UK Limited, the wholly owned foreign subsidiary, commenced operations in the December 2025 quarter, posting FY26 revenue of ₹1.58 Cr and a net loss of ₹0.20 Cr — a toe in the water, not a plunge. In January 2026, Prabodh K. Nahar took over as Executive Director and CFO as Ram A. Kabra stepped down. And at the 44th AGM, CMD Rajesh Ranka was reappointed at ₹4.4 lakh per month from 1 July 2025.

Borrowings, meanwhile, have crept back up: ₹2.26 Cr in FY23 became ₹23.29 Cr in FY25 and ₹32.66 Cr in FY26. After the great debt vanishing act of FY23, the balance sheet has started taking on weight again.

7. Balance Sheet

ItemMar 2024Mar 2025Mar 2026
Total Assets201.75225.63255.39
Net Worth129.15132.73146.32
Borrowings2.2623.2932.66
Other Liabilities70.3469.6176.41
Total Liabilities201.75225.63255.39

Assets equal liabilities in every column, as they must.

  • Net worth has climbed three straight years, from a starting point that was negative for most of the prior decade. The reserves finally have somewhere positive to sit.
  • Borrowings rose from near-zero to ₹32.66 Cr in two years, funding an asset base that grew ₹54 Cr over the same stretch.
  • Inventory of ₹99.12 Cr against sales of ₹300.58 Cr is the elephant in the warehouse — more than four months of stock sitting on the floor.

Against ₹32.66 Cr of borrowings, cash and bank stands at ₹4.32 Cr and investments at ₹20 Cr. This is a net-debt position, not a cash cushion.

A balance sheet can be repaired faster than a reputation for qualified audits.

8. Cash Flow: Sab Number Game Hai

YearOperatingInvestingFinancing
Mar 202424.41-21.92-3.06
Mar 2025-7.53-18.3019.80
Mar 2026-2.92-2.398.64

The trail is not flattering. Operating cash flow was healthy at ₹24.41 Cr in FY24, then turned negative in both FY25 (-₹7.53 Cr) and FY26 (-₹2.92 Cr). Across those two years, the financing line went positive — ₹19.80 Cr then ₹8.64 Cr — which lines up with borrowings rising. When operations stop generating cash, the money to keep moving comes from somewhere, and here it came from lenders.

A profit on the P&L that doesn’t show up in operating cash flow is a profit worth reading twice.

9. Ratios: Sexy or Stressy?

RatioValue
ROE9.35%
ROCE12.8%
P/E12.5
PAT Margin4.3%
D/E0.22

ROE of 9.35% means the equity is working, but part-time — a return that a fixed deposit does not have to run a wool mill to match. ROCE at 12.8% recovered sharply from 3% in FY25, so the capital is at least earning its keep again. PAT margin of 4.3% on ₹300 Cr of sales is thin, and thinner still once you remember other income padded it. D/E of 0.22 is modest — the leverage is small, which is the one line here that isn’t asking hard questions.

10. P&L Breakdown: Show Me the Money

YearRevenueOperating ProfitOther IncomePATEPS (₹)
Mar 2024300.28303.5925.437.31
Mar 2025260.0419.853.370.97
Mar 2026300.581411.6913.043.75

The Other Income column is where this table earns its place. In FY26, other income of ₹11.69 Cr sits alongside operating profit of roughly ₹14 Cr — meaning nearly as much profit came from non-operating sources as from spinning yarn. Anchor the story on operating profit and PAT, not the headline: the operating line collapsed to ₹1 Cr in FY25 (OPM near 0%), recovered to ₹14 Cr in FY26, and the real swing year was FY24 at ₹30 Cr.

And a footnote worth its own paragraph: FY23 booked ₹192.93 Cr of other income, driving PAT to ₹214 Cr — the same year borrowings vanished and reserves turned positive. That was balance-sheet surgery landing in the P&L, not a year of selling ₹214 Cr worth of wool. EPS moves in step with PAT throughout — no share-count trickery here; the count held at 3.48 Cr shares.

11. Peer Comparison

CompanyRevenue (Qtr)PAT (Qtr)P/E
K P R Mill1,784.65227.1746.3
Vardhman Textile2,497.98189.2625.2
Welspun Living2,435.43106.1672.7
Trident1,632.53101.9835.6
Indo Count1,057.6824.2067.6
Garware Tech.426.4157.2634.8
Modern Threads78.144.4112.5

Modern Threads is the smallest company in the room by an order of magnitude — quarterly revenue of ₹78 Cr against peers running ₹1,000–2,500 Cr. It also carries the lowest multiple, roughly half the peer median, on the lowest absolute profit. The peer set trades at 25–73x; this one trades at 12.5x. Same industry, very different pricing — a fact the size gap and the audit history together explain more than any single line does.

12. Miscellaneous: Shareholding & Promoters

Holder%
Promoters65.16
Institutions (DII)10.70
Public24.14

Promoter holding has been rock-steady at 65.1% with zero pledging — the Ranka family, via Generotrade Exim LLP (45.03%) and the Arihant Beneficiary Trust (20.13%), holds firm. Legacy institutional names linger on the register: Unit Trust of India, Gujarat State Financial Corporation, and the Administrator of the Specified Undertaking of UTI, holdovers from an older chapter of Indian capital markets.

The promoter roast writes itself lightly: a family that steered a company through decades of negative reserves and a BIFR scheme and came out the other side still holding two-thirds. Survival is its own kind of track record.

13. Corporate Governance: Angels or Devils?

The audit opinion is qualified, and the filing itself labels the frequency “repetitive.” Two flags recur: the company has not provided for interest (dividend) on cumulative redeemable preference shares — ₹36.13 lakh for FY26, cumulative ₹1,083.87 lakh (₹10.84 Cr) — pending settlement with those shareholders; and balances of trade payables and trade receivables remain subject to confirmation, with the impact, per management, unascertainable.

Separately, a deferred tax asset of ₹1.57 Cr has not been recognised, on the view that future taxable profits may not be available to absorb it — a quiet admission from within the company’s own accounts. Board and audit-committee structure is in place, the cost auditor was reappointed, and promoter pledging is nil. These aren’t fraud flags; they’re the accounting residue of a company still cleaning up a very old mess, laid out in the auditor’s own words rather than smoothed over.

14. Industry Roast & Macro Context

Indian textiles is a sector where everyone owns a spindle and nobody owns pricing power. Worsted yarn and wool tops ride raw-wool costs — much of it imported Australian merino — while competing on export orders against countries with cheaper labour and friendlier currencies. Margins live and die on the spread between wool bought and yarn sold, which is why the whole peer set posts single-digit-to-low-teens ROCE and thin quarterly profit variance that swings negative for half the table in any given quarter.

Then there’s the newly effective bundle of four labour codes, live from 21 November 2025 with rules still to be notified — the kind of regulatory overhang that every mill in the country is now assessing and none can yet price. For a small operator carrying 217 days of inventory into a commodity input cycle, the sector’s oldest lesson applies: in textiles, the wool doesn’t wait for the balance sheet.

15. EduInvesting Verdict

StrengthsWeaknesses
Reserves positive and rising three years; near-zero pledgingOperating profit thin; PAT leans heavily on other income
ROCE recovered to 12.8%, above peer medianRepetitive qualified audit opinion; unconfirmed trade balances
Low D/E of 0.22; stable 65% promoter holdingNegative operating cash flow two years running; 217-day inventory
OpportunitiesThreats
New UK subsidiary; export reach to 25+ countriesRising borrowings, from ₹2.26 Cr to ₹32.66 Cr in two years
Recovery in yarn demand could lift the operating lineRaw-wool cost cycles; unnotified labour-code impact

Modern Threads spent a decade climbing out of a hole it dug itself, and FY26 is the first stretch where the ground looks level — until you check whose signature is on the audit and where the profit actually came from. A company that fixed its balance sheet faster than it fixed its books, still spinning yarn the market prices at half the going rate.

Leave a Reply