1. At a Glance – Tiny Market Cap, Massive Drama
₹117 crore market cap.
₹10 stock price.
150% return in 3 months.
508% return in 6 months.
P/E of 5.48 when industry median sits around 20+.
Quarterly sales up 138%.
Quarterly profit up 795%.
Ladies and gentlemen, welcome to Modern Malleables Ltd, the company that went from “Who?” to “Wait, WHAT?” in one quarter.
At ₹10 per share and trading at just 0.66 times book value, the stock looks like it’s on clearance sale in a Diwali dhamaka. But before you shout “multibagger,” remember this: ROCE is 0.81% and ROE is 1.19%. Yes, those are real numbers. Lower than your savings account interest.
Q3 FY26 (Dec 2025 quarter) numbers are loud. Sales at ₹31.46 crore. Net profit ₹4.17 crore. EPS ₹0.36. The company has suddenly started printing money after years of… confusion.
Is this a phoenix rising from ashes or just a temporary fireworks show?
Let’s investigate like a detective who doesn’t trust sudden success.
2. Introduction – The Comeback Kid Nobody Noticed
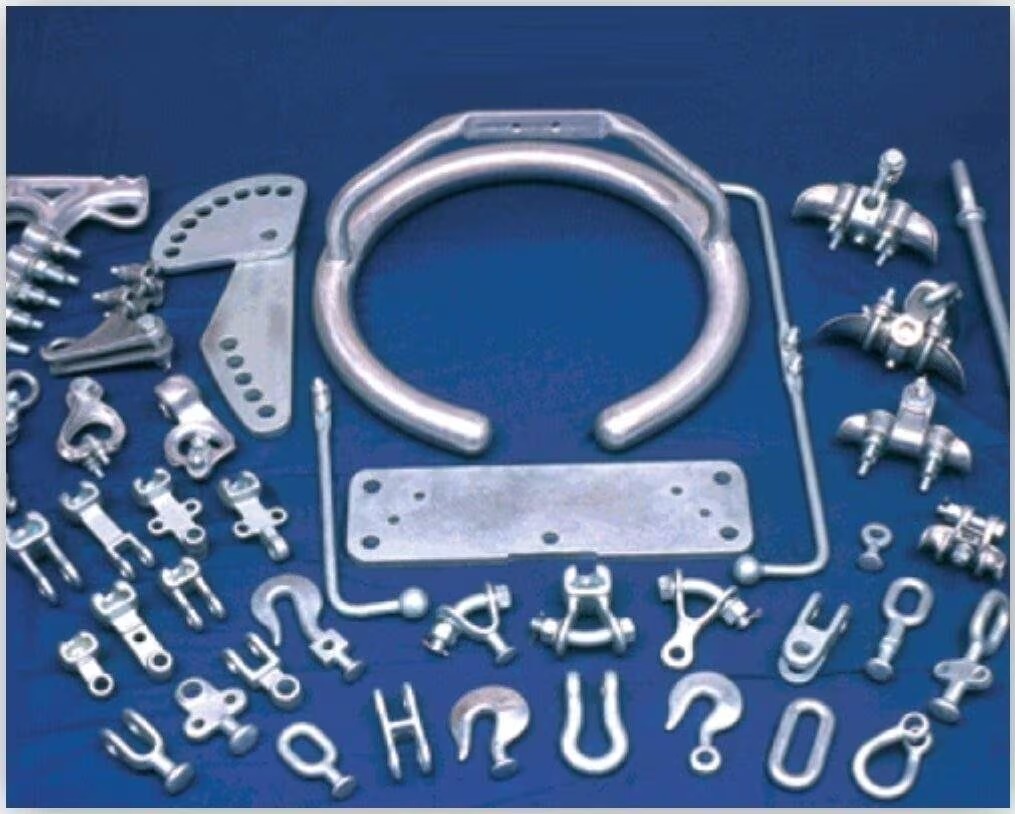
Founded in 1982, Modern Malleables is in the power and communication accessories business. Not glamorous. Not tech. Not AI. No EV buzzwords. Just conductor accessories, insulator fittings, and overhead transmission hardware.
Basically, the nuts and bolts of India’s power lines.
For years, the company’s numbers looked like a Bollywood side character. Losses, flat revenue, inconsistent profitability. Sales growth over 5 years? Negative 10.9%. Profit growth over 5 years? Down 42%.
Then suddenly in TTM:
- Sales growth: 356%
- Profit growth: 7,020%
That’s not growth. That’s a personality change.
But here’s the catch: earnings include ₹11 crore of other income in FY25. When “other income” is louder than operating performance, you must raise one eyebrow.
Still, debt is almost zero. Borrowings just ₹2 crore in Sep 2025 quarter. Debt to equity: 0.01.
So the balance sheet isn’t screaming. But working capital days have ballooned to 222 days. Debtor days up to 126. Inventory days at 333. Cash conversion cycle? 242 days.
Translation: Money is stuck in the system like traffic