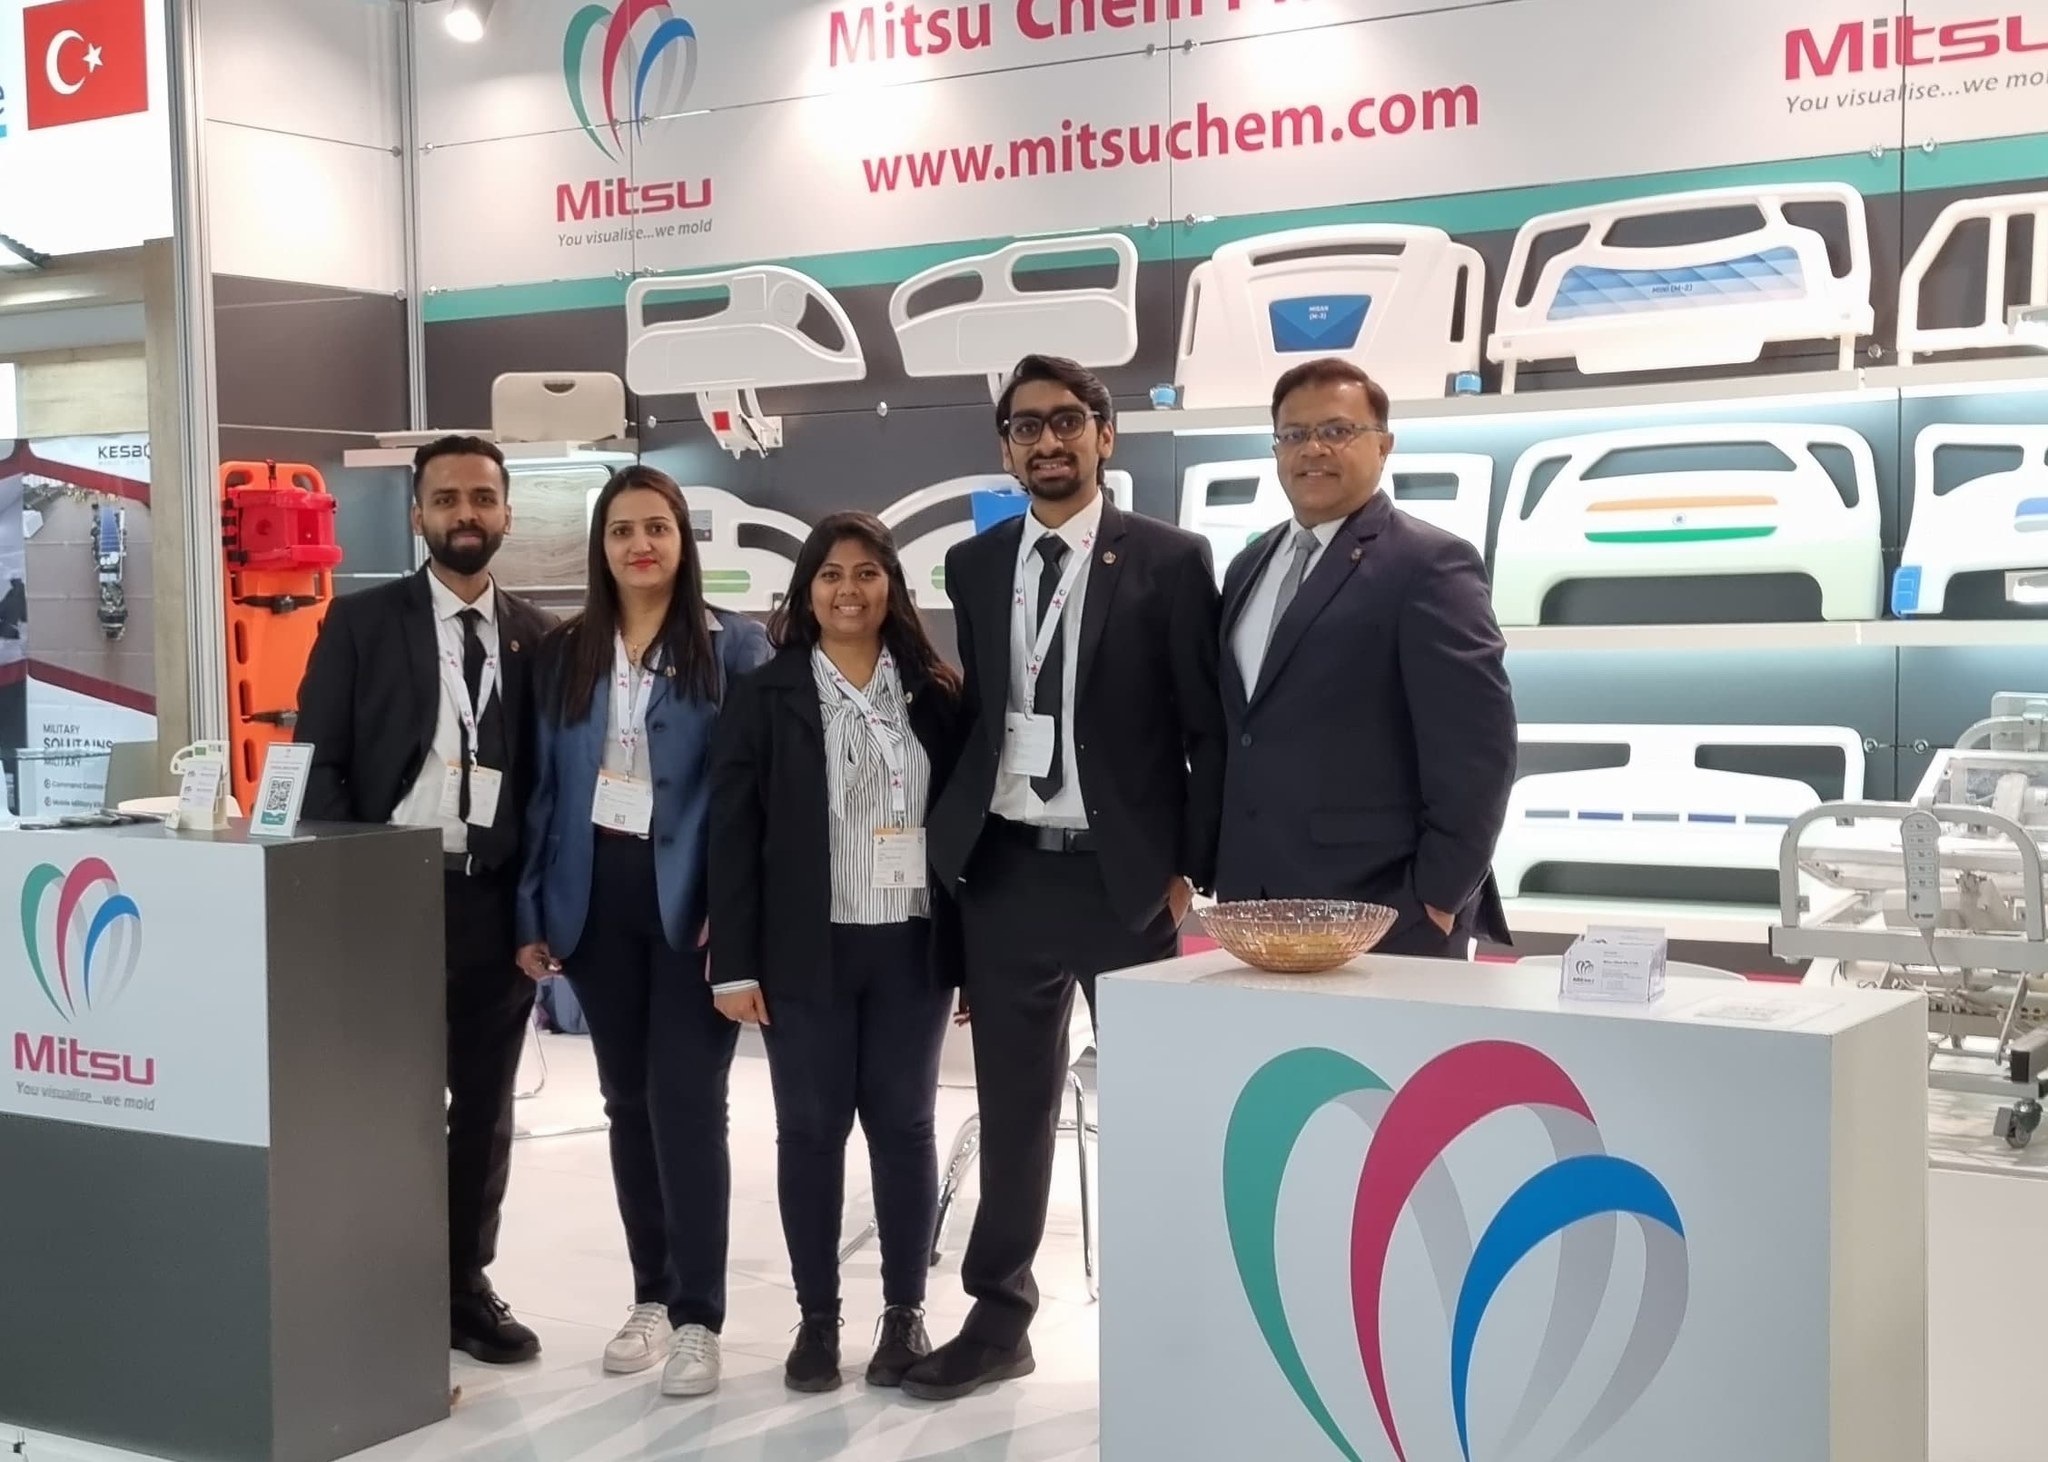
Mitsu Chem Plast Q4 FY26: The Margin Story Turns Real
Spotted a factual error — a wrong number, date, or fact? Tell us and we will check the source.
General information and entertainment, not investment advice. The author is not a SEBI-registered adviser or research analyst. No recommendation, no promised returns. Markets carry risk including loss of capital. Figures may not be current. Consult a registered adviser before acting.
1. At a Glance
FY26 ended with Mitsu Chem’s earnings doubling—net profit ₹15.62 Cr against ₹7.25 Cr the year prior. Q4 alone delivered ₹7.72 Cr net profit, a 118% YoY jump. But the real story is margin: EPS ramped to ₹5.69, up from ₹2.61 a year ago. This marks the company’s sharpest turnaround since the 2022 earnings collapse. The machinery that was grinding slowly is now spooling hard.
At ₹150.90 per share (prices referenced are not live), the market pays 13.0x on latest twelve-month earnings. The P/E sits nearly half the peer median of 21.18x—whether because the market doubts margin sustainability or because the last quarter borrowed tailwinds from commodity dynamics remains the central question.
What complicates the cheer: raw material costs spiked 40% from war disruptions, then eased to 30% above normal. When that normalises (management expects “1 or 2 months”), the benefit reverses. The order book in blow molding runs no longer than a month—visibility to maintain this pace is thin.
2. Introduction
Mitsu Chem Plast (MCL) was incorporated in 1990. For over three decades it has moved plastic granules into boxes, jerrycans, furniture parts, and medical equipment. Listed in 2016 on the SME platform, it migrated to the main board in May 2020. The company spans four facilities—Units 1 and 2 in Tarapur (56,000 sq ft combined), Unit 3 in Khalapur (96,000 sq ft), and Unit 4 (60,000 sq ft, recently ramped). Installed capacity now sits above 29,900 MT/year.
The customer roster runs thick with household names: Godrej, Tata, BASF, Cipla, Castrol, Parle, Aarti. The top 10 account for 21.81% of revenue; the tail is broad and fragmented. Revenue composition: containers at 86%, furniture and healthcare at 11.45%, the remainder miscellaneous. Geographic footprint stretches across 17 countries; exports accelerated sharply in FY26.
Board leadership remains family-rooted. Jagdish Dedhia (35 years in plastic) chairs. Sanjay and Manish Dedhia—both sons—serve as MDs; Manish also handles CFO duties. Promoters hold 67.77% as of March 2026, a modest shade down from 73% two years prior. A recent independent director (Dilip Gosar) stepped down in June 2026 after his term ended.
3. Business Model: WTF Do They Even Do?
The company makes blow-molded, injection-molded, and custom plastic parts. Blow molding dominates—bottles, drums, containers, pails—using HDPE, PP, and filled polymers.
The volumes go into pharma (syrups, injectables), agrochemicals (pesticides, crop boosters), FMCG (cooking oil, edible oils, sauces), food (honey, jam, spice pastes), chemicals (lube oils, cleaners), and cosmetics. One container feeds many industries; the margin lives in the mix and the customer’s loyalty.
Injection molding is the niche lever: small caps, closures, fittings, rigid components. Margins here—15–25%—run above blow molding’s 10–12%, but volumes are a fraction.
Healthcare furniture under the Furnastra brand is the third pillar: hospital beds, bed frames, side railings, mattress platforms, CPR boards, overbed tables. Design-registered, built for durability. This segment pulls 15–20% EBITDA margins, managed on a project or OEM partnership model. A 2025 tie-up with a global (Polish) hospital furniture leader is now supplying designs “world over.”
Custom molding—automotive seating parts, stadium seats, test kit housings—rounds it out. Each vertical has different unit economics, order book cadence, and competitive structure.
The upside bet: scale packaging to ₹800–900 Cr, push Furnastra to ₹150–200 Cr, and launch Intermediate Bulk Containers (IBC) in Q2 FY27—a new category with fewer competitors and better margins. Management framed the IBC entry as a “natural extension” and claims margins will beat standard containers.
4. Financials Overview
Figures are consolidated, in ₹ crore.
Result Type: Annual (Full Year). Latest Period: FY26 (year ended 31 Mar 2026).
Metric
FY26
FY25
YoY
Revenue
350.17
332.28
+5.4%
EBITDA
34.66
23.28
+48.9%
PAT
15.62
7.25
+115.4%
EPS
11.50
5.34
+115.4%
Q4 FY26 performance (in ₹ cr):
Metric
Q4 FY26
Q4 FY25
QoQ (Q3 FY26)
Revenue
86.47
90.47
+0.6%
EBITDA
14.23
8.22
+165%
PAT
7.72
3.54
+163%
EPS
5.69
2.61
+118%
The Q4 story: Revenue inched up 0.6% sequentially—stalled relative to Q2 and Q3. But operating profit jumped 165% QoQ to ₹14.23 Cr and EBITDA margin rocketed to 16.45%, the highest in the trailing dataset. Management attributed the lift to “value addition” (a euphemism for repricing and product mix), operational efficiency gains (begun in Q3), and “1–2%” tailwind from war-driven commodity dynamics.
FY26 full-year: Revenue grew just 5.4% to ₹350.17 Cr. PAT doubled to ₹15.62 Cr. The improvement skews to margin expansion, not volume. Management confirmed they “compromised” sales growth because they were “prioritizing profitable volumes.” Translation: they walked away from low-margin business. That posture proved prescient; the earnings base is higher-quality even if top-line looks sluggish.
Concall Color: Management reaffirmed 10% EBITDA margin as a “floor,” stating they “always say that this 10% should be minimum.” They flagged the 16.5% Q4 margin as partly temporary (the war tailwind) and guided for a 30% revenue growth in FY27, skewed to 2H, once new capacity (Unit 4 ramp and IBC) and improved mix take hold. Order book visibility remains thin—typical for blow molding—so the 30% guidance rests on management’s confidence in pipeline conversion, not binding commitments.
5. Market Expectations & Historical Multiples
This section describes how the market is currently pricing the company and how that compares with its own history and peer group. It is descriptive, not predictive.
Metric
Current
Historical Average
Peer Median
P/E
13.0
45.2
21.18
EV/EBITDA
7.58
16.8
14.2
ROE
15.0%
14.2%
12.3%
ROCE
16.3%
14.8%
12.45%
The market currently pays 13.0x on annualised earnings, versus a historical average of 45.2x across the past decade. This 71% discount to the long-run mean signals either deep scepticism or complacency. Peers in rigid packaging trade at 21.18x on average; Mitsu sits at 13x, a 39% haircut.
EV/EBITDA stands at 7.58x, below the peer band of 14.2x. Return metrics (ROE 15%, ROCE 16.3%) exceed both the 10-year average and the peer median—suggesting operational efficiency is real, not a mirage. Yet the valuation assigns no premium.
The market appears to be pricing in profit sustainability concerns rather than near-term earnings power. It is reserving the optionality that margin normalises downward once war-driven tailwinds fade and/or that the new IBC business fails to launch at promised contribution. Alternatively, the small market cap (₹205 Cr) may simply be too illiquid for institutional capital to build a position.
6. What’s Cooking
IBC Entry (Q2 FY27 commissioning): A fully automated plant for Intermediate Bulk Containers at Khalapur. Management positioned it as a “significant strategic milestone” and promised disclosure details in Q2. No capex or capacity guidance released. The business logic is clear—IBCs serve chemical, pharma, and FMCG end-markets with fewer entrants than rigid containers. Management expects “better margins” due to reduced competition. Revenue timing will be lumpy (capex-gated customer adoption).
Order Book Strength: Management added 175 customers in FY26. Exports jumped 110% YoY (nine months data to Dec