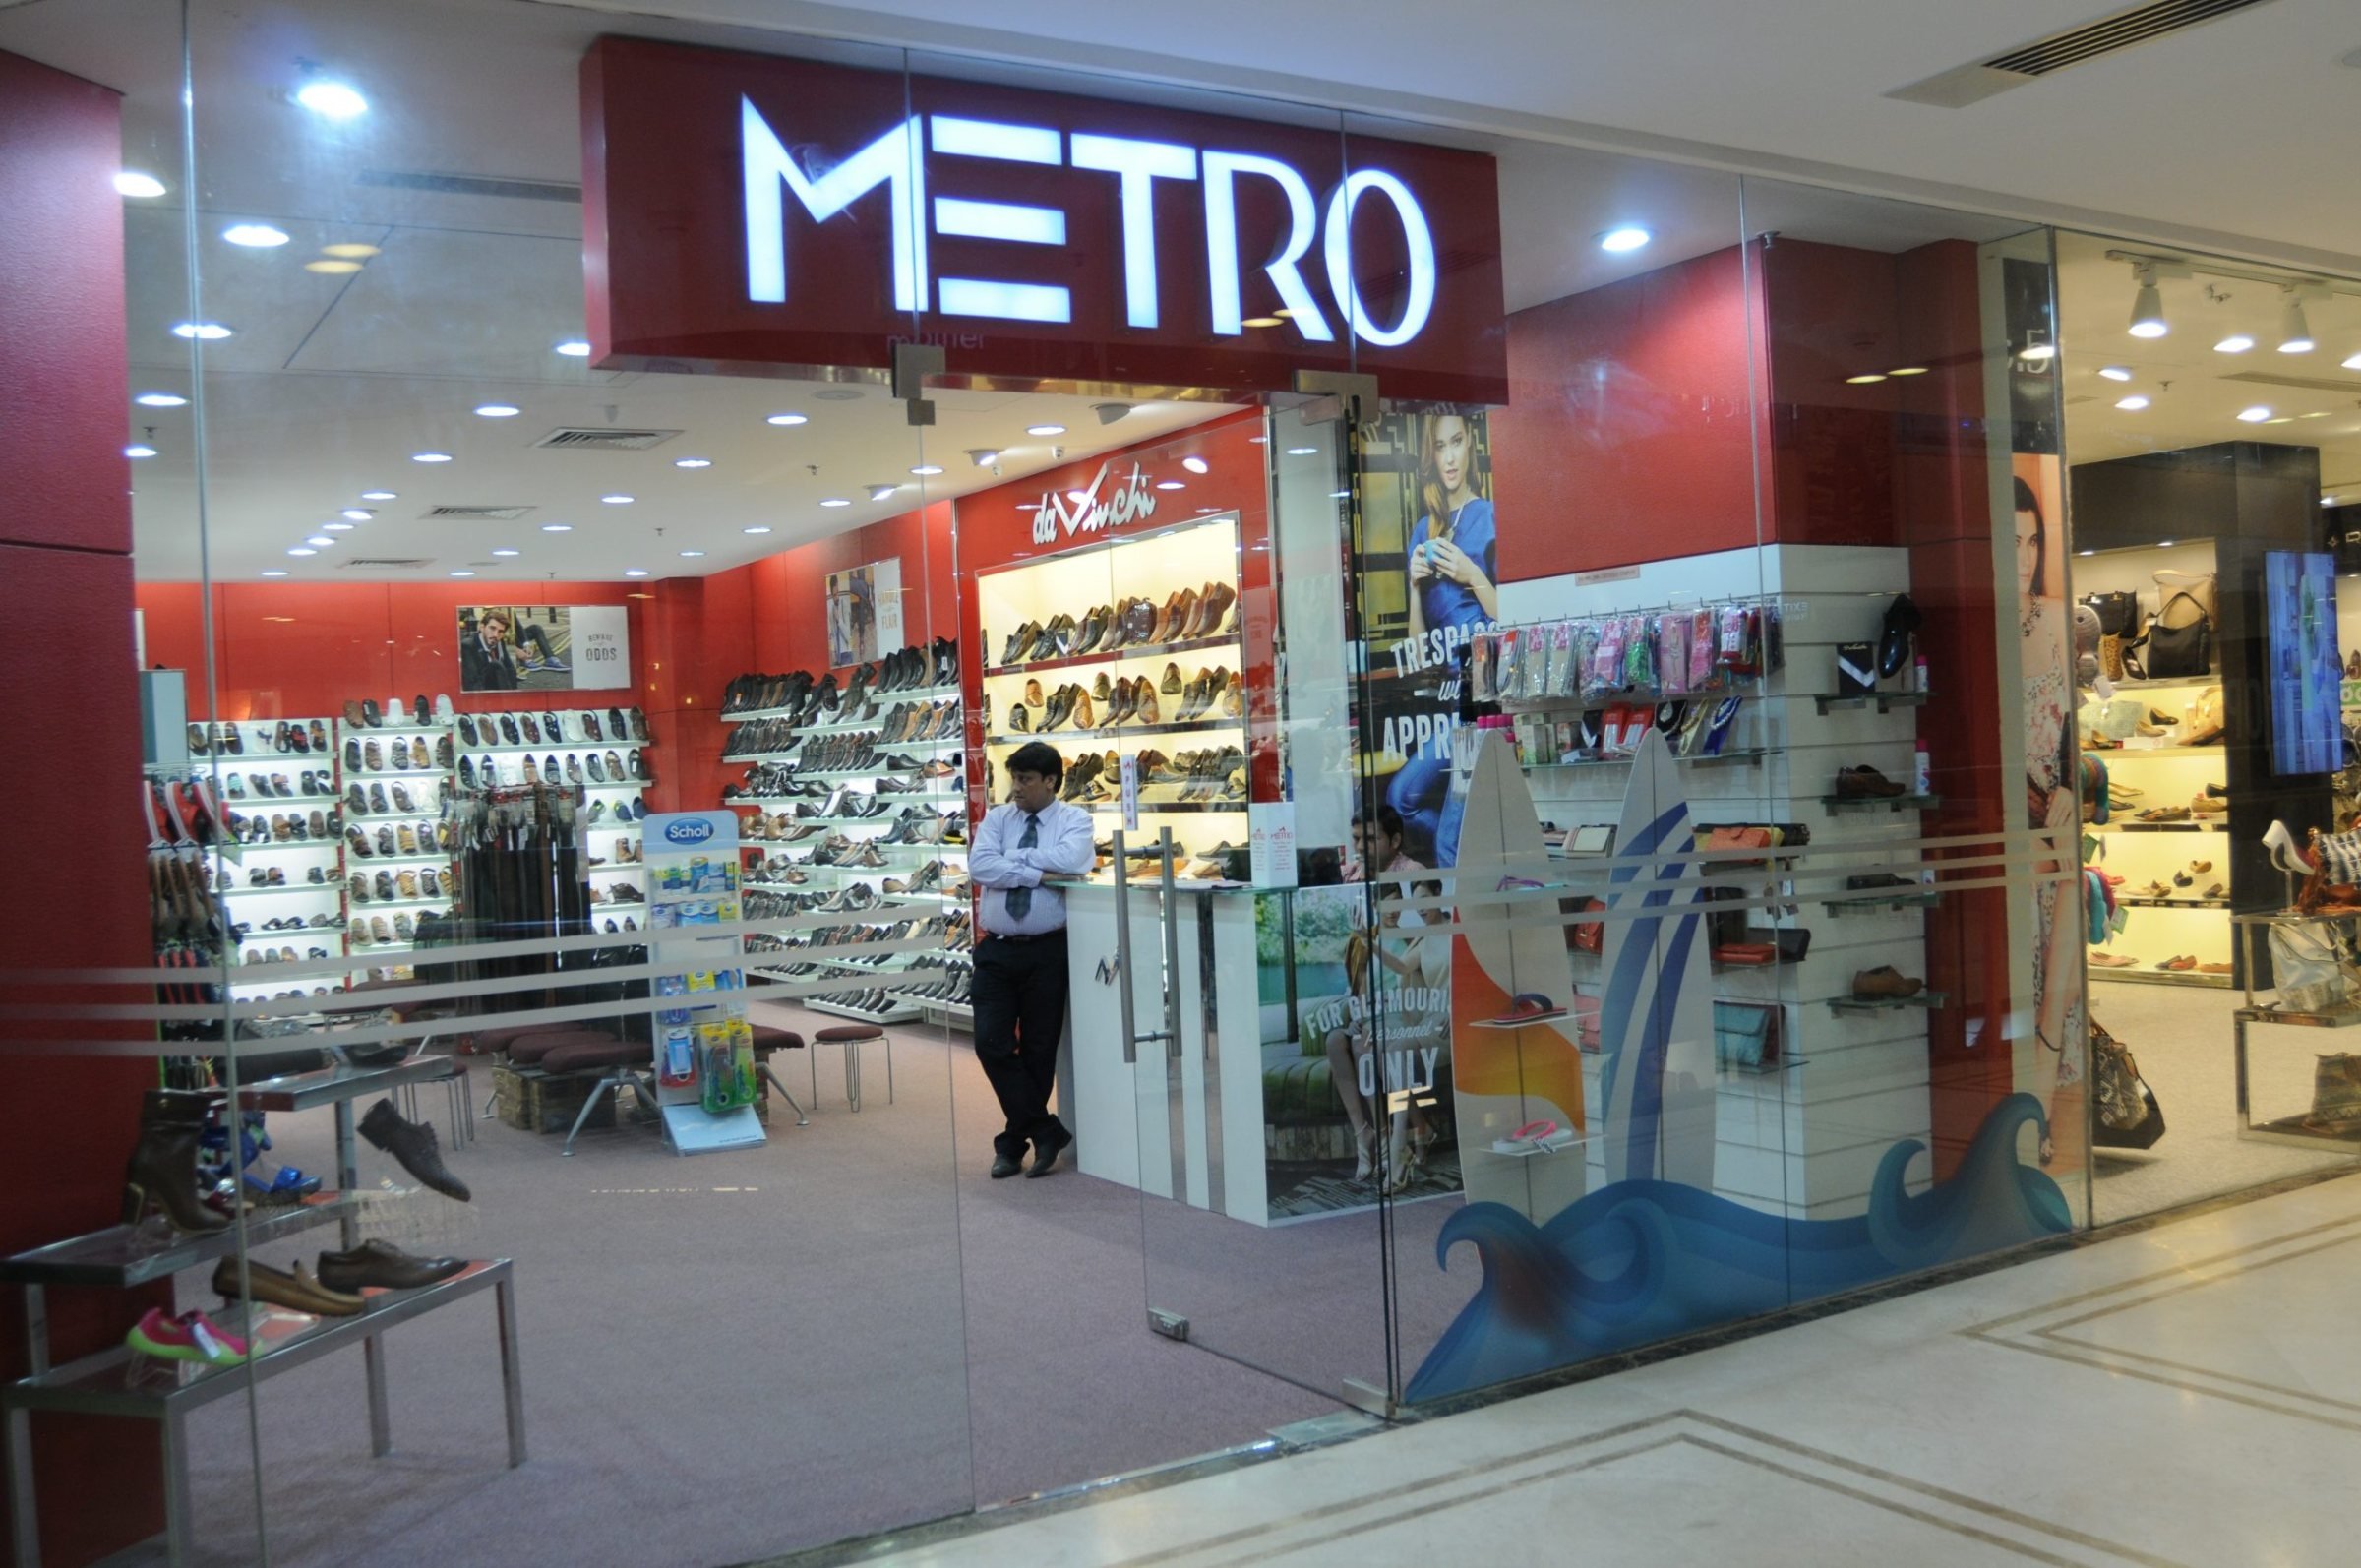
Metro Brands Mar 2026: The ₹1,059 Premium on 1,032 Walls of Shoes
Section 1 — At a Glance
Metro Brands Limited concluded the financial year ending March 31, 2026, by crossing a critical operational milestone, expanding its retail footprint to 1,032 stores across 221 cities. Consolidated revenue from operations for FY26 reached ₹2,864 crore, representing a year-on-year expansion of 14.2% from ₹2,507 crore in FY25. This growth trajectory was punctuated by a sharp acceleration in the final quarter, where Q4 FY26 consolidated revenue grew by 20.3% to reach ₹773 crore. Operating leverage and sustained pricing power within the premium assortment allowed the company to defend its profitability metrics, delivering a full-year consolidated EBITDA of ₹869 crore at a stable margin of 30.3%.
Beneath the headline operational metrics, structural capital commitments and macro regulatory friction require closer investor scrutiny. The company’s inventory asset line scaled significantly, closing at ₹856 crore in FY26 compared to ₹637 crore in the previous fiscal year, which compressed core working capital efficiency. Simultaneously, expansion across international licensed banners like Foot Locker and FILA faces operational gating from Bureau of Indian Standards (BIS) quality control compliance, leaving select formats operating up to 25% below initial internal productivity targets. In multi-brand retail, aggressive physical storefront expansion must be met with immediate local demand, or the structural drag of lease liabilities will outpace capital returns. Profit after tax for the full year stood at ₹416 crore, up 17.5% from ₹354 crore in FY25, heavily aided by a lower tax rate baseline in the current year.
Section 2 — Introduction
Metro Brands operates as a dominant retail aggregator in the Indian footwear ecosystem, navigating the transition from a traditional multi-brand storefront network into an omni-channel platform. The corporate trajectory spans from its single-store origins in 1955 to a multi-format retail engine managing long-term international licensing moats. The current strategy relies on a barbell approach: defensive cash generation from high-margin home private labels, paired with capital-intensive growth bets on global athleisure and lifestyle distributions. As the domestic consumer shifts toward structural premiumisation, the company is systematically altering its product mix, adjusting inventory allocations to cross the threshold of tier-structured consumption across 31 states and union territories.
Section 3 — Business Model: WTF Do They Even Do?
Metro Brands sells footwear by convincing the market that a distributed retail storefront is a platform asset, not a real estate liability. The business relies entirely on an outsourced manufacturing architecture, meaning they do not lay bricks or run assembly lines for any of their private labels. Instead, they leverage a network of over 250 third-party vendors, some held captive through twenty-year relationships and exclusive design agreements that prevent them from selling identical silhouettes to competitors. The merchandise mix is heavily skewed toward premium tiers, with products priced above ₹3,001 contributing 54% of total store sales in FY26, which drives an absolute realization per pair up to ₹1,600.
The portfolio is split into multi-brand outlets (MBOs) like Metro and Mochi, value formats like Walkway targeting the unorganized white space of smaller towns, and premium exclusive brand outlets (EBOs) like Crocs. Under their third-party agreements, Metro frequently enjoys structural safety valves where they pay for inventory only post-sale or retain the right to send aging, dust-gathering pairs back to the brand owners. In essence, they act as an asset-light toll booth on the feet of India’s affluent middle class.
Section 4 — Financials Overview
Figures are consolidated, in ₹ crore.
Metric
Latest Quarter (Mar 2026)
YoY
QoQ
Revenue
₹773
20.3%
-4.7%
EBITDA / Operating Profit
₹238
20.5%
-10.2%
PAT
₹118
23.5%
-9.2%
Reported EPS (₹)
₹4.28
23.0%
-9.1%
The final quarter of FY26 delivered a strong revenue bump of 20.3% YoY, outperforming the more muted 12.1% pace recorded in the initial nine months of the fiscal. While the topline expansion appears smooth on an annual basis, sequential quarterly performance shows the natural volatility of wedding calendars and festive lulls, with revenue softening by 4.7% against the December quarter. Operating cash flow conversion remained resilient, though the quality of quarterly earnings must always be judged by how cleanly operational cash flows shadow accounting profits across cyclical inventory builds.
What is Management Promising in the Coming Quarters?
During the earnings dialogue, management laid out forward expectations around supply normalization and the commercialization