1. At a Glance
Metro Brands is basically the Ambani of Indian shoe retail — 895 stores across 31 states, catering to everyone from college kids in Mochi sneakers to uncles in Metro leather formals. FY25 revenue hit ₹2,560 Cr with a mouth-watering 30% OPM, but net profit actuallyfell 13% YoY. Investors are still lacing up at an83.8x P/E, which suggests the market believes shoes will become the next gold. Oh, and they don’t make a single shoe themselves — it’s all outsourced.
2. Introduction
In a country where people still take off shoes before entering a house, Metro Brands has figured out how to make you buy more of them before you even realise you “needed” a new pair.
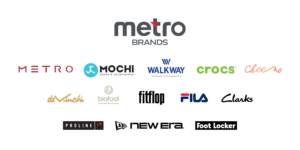
Their store network reads like a Bollywood franchise:
- Metro: The “family entertainer” of footwear.
- Mochi: Trendy kicks for the Instagram generation.
- Crocs: The brand that turned ugly into premium.
- Walkway: Value shoppers’ paradise.
- Plus Fitflop, Fila, Foot Locker, and New Era for the brand-hungry.
They’ve mastered the art of being aone-stop footwear supermarketwhile keeping capital light — no factories, minimal inventory risk (suppliers get paid after the shoe sells, sometimes returned if it doesn’t). That’s basically a retailer’s dream model.
3. Business Model (WTF Do They Even Do?)
- 74% revenuefrom in-house brands: Metro, Mochi, Walkway, Da Vinchi, J. Fontini.
- Remaining from exclusive tie-ups: Crocs, Skechers, Clarks, Fitflop, Fila, Foot Locker, New Era.
- Channels: 88% in-store, 8% online, 3% omnichannel.
- Asset-light supply chain: outsourced production, vendor base of 250.
- Target: open225 more stores by FY26(excluding Fila).
They essentially
sell everyone else’s products (plus their own labels), keep margins high with premium positioning, and turn stores into mini fashion runways for the middle class.
4. Financials Overview
| Metric | Q1 FY26 | Q1 FY25 | QoQ % | YoY % |
|---|---|---|---|---|
| Revenue (₹ Cr) | 628 | 576 | -2.3% | 9.1% |
| EBITDA (₹ Cr) | 194 | 180 | -1.5% | 7.8% |
| PAT (₹ Cr) | 99 | 92 | 4.2% | 7.4% |
| EPS (₹) | 3.62 | 3.37 | — | — |
| OPM % | 31% | 31% | — | — |
Margins are still designer-level, but top-line growth is slowing, and PAT isn’t running ahead like it used to.
5. Valuation (Fair Value RANGE only)
Method 1: P/E
- EPS (TTM): ₹13.14
- Sector P/E: 35–45
- FV Range: ₹460 – ₹590
Method 2: EV/EBITDA
- EBITDA (TTM): ₹771 Cr
- EV/EBITDA sector range: 20–25
- FV EV = ₹15,420 – ₹19,275 Cr → Per share: ₹565 – ₹707
Method 3: DCF (simplified)
- Growth: 12% for 5 years, WACC 10%, terminal growth 4%
- FV ≈ ₹520 – ₹680
Fair Value Range (Educational Only):₹460 – ₹707Disclaimer: For educational purposes only — not investment advice.
6. What’s Cooking – News, Triggers, Drama
- Fila & Foot Locker:
