1. At a Glance
Once a metals company, now reborn as an EV maker, Mercury EV-Tech has gone from steel to steel-on-wheels. With electric scooters, buses, golf carts, vintage cars, and now batteries certified by Reliance Jio labs, the company’s story reads like a startup pitch deck — except it’s been listed since 1986. FY25 revenue jumped to ₹108 Cr (up 454% YoY), profit surged 411%, but at a93x PE, investors are basically paying for 2030 today.
2. Introduction
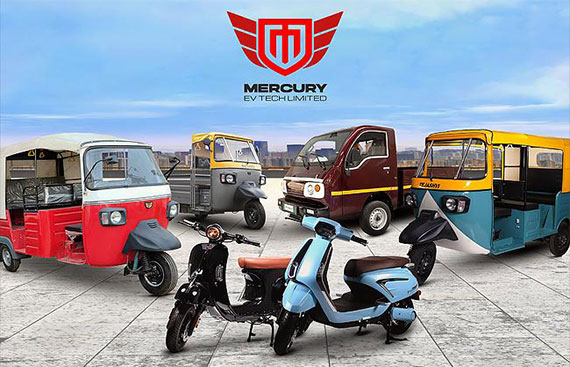
Mercury EV-Tech was once Mercury Metals — a name that screamed scrap dealers, not superchargers. In March 2023, the company swapped its name and its image, promising to ride India’s EV wave. Today, it makes every kind of electric vehicle you didn’t know you could buy:
- E-scooters & e-bikes
- Electric vintage cars (for the maharaja vibe)
- Electric buses & golf carts
- Custom EVs for hotels, clubs, and industrial use.
It’s also an auto-parts and battery supplier, with orders worth ₹110 Cr from a top 2W EV manufacturer and AIS-156 Phase-II battery certification via its subsidiary Powermetz Energy. Throw in a tractor company acquisition and special purpose EV approvals, and you’ve got a product portfolio as diverse as it is ambitious.
3. Business Model (WTF Do They Even Do?)
Mercury EV-Tech operates across:
- EV Manufacturing & Trading– Scooters, buses, vintage cars, golf carts, custom EVs.
- Battery Packs– Certified high-speed 2W batteries, BMS integration, and 24S LFP packs.
- Auto Parts & Accessories– Supporting in-house and third-party EVs.
- Subsidiaries– Powermetz Energy (battery tech), EV Nest (now merged), Traclaxx Tractors (65% stake), Haitek Automotive (70% stake).
Revenue FY23 split: 97% product sales, 3% other operating income.
4. Financials Overview
Quarterly Comparison (₹ Cr) – Jun 2025 vs
Jun 2024 vs Mar 2025
| Metric | Jun 2025 | Jun 2024 | Mar 2025 | YoY % | QoQ % |
|---|---|---|---|---|---|
| Revenue | 22.57 | 3.87 | 30.68 | 483% | -26.4% |
| EBITDA | 2.12 | 0.90 | -0.87 | 135% | N/A |
| PAT | 1.98 | 0.49 | 1.55 | 304% | 27.7% |
| EPS (₹) | 0.10 | 0.03 | 0.08 | 233% | 25.0% |
Annualised EPS (Jun 2025) = ₹0.10 × 4 = ₹0.40 → P/E =115xon CMP ₹46. FY25 EPS ₹0.50 → 93x PE.
Commentary:The YoY growth is insane, but QoQ drop in revenue shows volatility — maybe order-based lumpy sales rather than steady flow.
5. Valuation (Fair Value RANGE only)
- P/E Method:FY25 EPS ₹0.50 × sector PE (30–40) → ₹15 – ₹20
- EV/EBITDA Method:FY25 EBITDA ₹9 Cr; EV ₹825 Cr → EV/EBITDA = 91.6. If normalised to 20x → EV ₹180 Cr → ₹10.5/share.
- DCF Method:Assume 25% CAGR for 5 years, 4% terminal growth, 14% discount rate → ~₹18/share.
Fair Value Range:₹10 – ₹20This FV range is for educational purposes only and is not investment advice.
6. What’s Cooking – News, Triggers, Drama
- Big Orders:₹110 Cr battery supply order from leading 2W EV maker.
- Certification Win:AIS-156 Phase-II battery pack clearance


")