Search for Stocks /

Megamont Ltd, FY2026: A Sudden Appearance

Spotted a factual error — a wrong number, date, or fact? Tell us and we will check the source.

General information and entertainment, not investment advice. The author is not a SEBI-registered adviser or research analyst. No recommendation, no promised returns. Markets carry risk including loss of capital. Figures may not be current. Consult a registered adviser before acting.


1 — At a Glance

This is not a typo. A loss-making shell that reported ₹0 sales in FY2025 somehow landed ₹601 Cr in revenue in FY2026, pivoted its board, rebranded itself, and now sits at a market multiple that demands explanation.

The turnaround is real—₹6.22 Cr net profit, operating margins of 0.77%, and a business that sprang into existence mid-November 2025 through the acquisition of two subsidiaries (Nidimo Mont and Parent Mont) engaged in stainless steel and mild steel trading. The math is clean: the consolidated numbers flow, the auditor signed off, and the cash did move.

But a shell trading metal products at a 69x P/E with ₹51 Cr borrowed against a ₹433 Cr market cap raises one question that lingers: What is the market pricing in here?

Promoter conviction just arrived—Minal Patil and Mounica Maddukuri took 58.55% stake in March 2026 after a structured open offer at ₹22. The stock crossed ₹150 in recent trade. The tension between what was paid and what it trades at now deserves your attention.


2 — Introduction

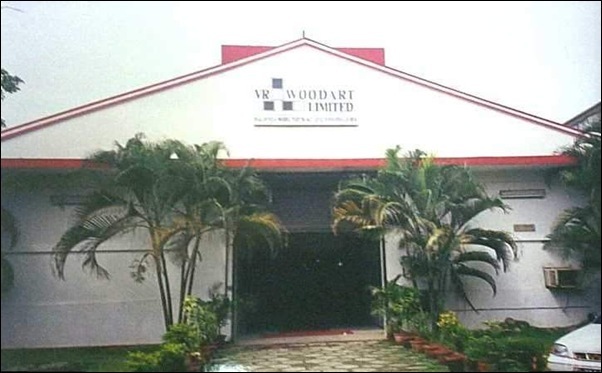
V.R. Woodart was incorporated in 1989 to make glue-laminated boards. By 2023, it wasn’t generating revenue. By 2024, it had negative reserves of ₹17 Cr. Then, in October 2025, the board approved an acquisition of two metal-trading entities that its new principals held stakes in.

The company renamed itself Megamont Limited on 6 February 2026. The name change is administrative; the business change is radical.

In November 2025, Megamont allotted 1.39 Cr equity shares at ₹22 per share (premium ₹12) on a preferential basis. It raised ₹30.68 Cr net (after share issue expenses). It also issued 44.8 Cr warrants at the same strike, locked for 18 months of potential dilution. Simultaneously, it converted a ₹22 Cr interest-free loan to its subsidiary Nidimo Mont into equity.

Between 14 January 2026 (EGM approval) and 28 May 2026 (auditor sign-off), the structure was: Megamont at holding level; Nidimo Mont and Parent Mont as wholly owned subsidiaries; Nidimo Mont acquired the domestic export business division of a partnership firm also named Nidimo Mont. All three transactions were under “common control,” so the pooling-of-interests method applied. Translation: no goodwill, no amortization—book value only.

Three directors resigned in October 2025. Minal Patil (Chairperson), Suhas Deore (CFO), and new independent directors stepped in. In FY24, there were three company secretary resignations inside seven months.


3 — Business Model: WTF Do They Even Do?

Nidimo Mont (now the core engine) was a partnership firm trading wholesale and retail stainless steel and mild steel products. Parent Mont was acquired for ₹0.10 Cr. Nidimo Mont for ₹3.10 Cr. On slump sale basis, Nidimo acquired the assets of the original Nidimo Mont partnership and folded the firm. The trading business—buying and selling SS and MS products to institutions, workshops, and distributors—is unremarkable commodity steel.

The previous wood business (glue-laminated boards, mug trees, cutting boards, bedroom furniture units) was abandoned. Two of the three operational units had shut down years ago. The old story is dead.

The new story is: a holding company pivoted into steel trading through acquisition of lower-tier merchants. The model is margin-on-turnover—a 0.77% operating margin on ₹601 Cr is characteristic of commodity distribution. No moats. Pricing power = zero. Market share gains = market share losses elsewhere.

Nidimo Mont’s partnership structure meant no audited financials. The transfer to consolidated statements is now live. The business shipped ₹600 Cr in one financial year because it already existed—this is not a startup. It is a transplant.

The company carries ₹76.29 Cr in receivables (aged debtors matter in steel; metal moves fast or sits unpaid). Days sales outstanding is 46 days. Inventory is a non-factor (these are trading assets, not stock-in-hand). The working capital grip is tight.


4 — Financials Overview

Figures are consolidated, in ₹ crore.

MetricFY2026 (Latest)FY2025YoY Change
Revenue601.180.00
EBITDA5.97(0.00)
PAT6.22(0.13)+4,885%
EPS (Reported)2.15(0.09)

Notes on Results:

Other income of ₹5.73 Cr is material here (largely interest on fixed deposits). Strip it out and underlying operating profit is marginal—₹2.79 Cr on ₹601 Cr is a 0.46% operating margin (the reported 0.77% includes the ₹3.44 Cr quarter-end other income boost). The company is not generating operational leverage; it is managing debtors and holding cash.

Interest costs jumped to ₹2.11 Cr (new borrowings kicked in late in the year). Tax at ₹2.03 Cr on ₹8.24 Cr PBT is a 24.6% effective rate. The company is now subject to tax; no losses to carry forward.

Depreciation is immaterial (₹0.03 Cr for the full year suggests no fixed asset base in the consolidated structure—trading deals are asset-light). Finance costs will dominate going forward.


5 — Market Expectations & Historical Multiples

This section describes how the market is currently pricing the company and how that compares with its own history and peer group. It is descriptive, not predictive.

MetricCurrentHistorical AveragePeer Median
P/E69.6xN/A (first profitable year)22.2x (BSE tyres/rubber)
EV/EBITDA45.6xN/A~18x (comparable)
P/B12.0xN/A (reserves were negative last year)1.5–3.0x (typical)
ROE36.4%N/A7–15% (median)
ROCE23.7%N/A13.8% (median)

The market currently pays 69.6x on last year’s earnings for Megamont, sitting well above the peer median of 22.2x observed in the BSE tyres and rubber products group—a rough proxy for commodity/B2B materials trading. The EV/EBITDA at 45.6x is also elevated relative to 18x observed in comparable trading entities.

What is the market pricing in? The unusually high ROE of 36.4% (on a thin ₹6.22 Cr net profit and ₹17.09 Cr equity base) and ROCE of 23.7% suggest that the market is estimating either rapid growth in the trading business, a margin expansion at Nidimo Mont that was underreported pre-acquisition, or simply the belief that the new promoter group will extract value from the asset base over time. None of these are forecasts; they are observations of what the multiple implies.

The lack of historical comparable multiples (this is the company’s first profitable year) means the discount to history cannot be calculated. What is visible is the premium to peers: the market is not pricing Megamont as a commodity steel trader, even though the financials describe exactly that.


6 — What’s Cooking

Warrant Dilution (18 months out): The 44.8 Cr compulsorily convertible warrants at ₹22 will become 44.8 Cr new shares if exercised. Current shares outstanding are 2.89 Cr (adjusted). This is a 1,550% dilution event on the current base. The proceeds would inflate cash but likely fund the same business model—no new opportunity signal.

Receivables Aging: ₹76.29 Cr debtors on ₹601 Cr revenue is not excessive by metal-trading standards, but 46 days collection cycles leave room for deterioration if buyer solvency shifts. No disclosures on debtor concentration; metal traders often sell to a handful of large buyers.

Leverage Creep: Borrowings climbed from ₹2.12 Cr (FY25) to ₹51.03 Cr (FY26), a 24x increase. The debt-to-equity ratio is now 1.41x. The interest coverage ratio (EBIT ÷ Interest) is 4.91x, adequate but not comfortable if margins compress or credit tightens.

Cash Conversion Oddity: Operating cash flow was negative ₹68.94 Cr in FY26 (the business consumed cash to build receivables and fund the new balance sheet). This is normal for a trading business in ramp-up (receivables went from ₹0 to ₹76 Cr in one year). But it signals that reported profits are not cash profits yet.

Fixed Deposit Lock-in: The company invested ₹25.2 Cr in fixed deposits (likely ₹989.80 Cr per consolidated balance sheet), a conservative treasury position that yields ~7% and does nothing for growth.

Acquisition Under Common Control: The pooling-of-interests method applies because the promoters already controlled the partnerships being acquired. This is a restructuring, not a M&A expansion into a new business or market segment.


7 — Balance Sheet

ItemFY2025FY2026
Total Assets0.1693.93
Total Liabilities0.1693.93
Equity Capital14.8928.88
Reserves(17.02)7.37
Borrowings2.1251.03
Other Liabilities0.016.65

Assets = Liabilities ✓ (93.93 = 93.93).

The balance sheet went from a shell (₹0.16 Cr assets, negative reserves) to a functional trading entity in one year. The ₹93.75 Cr “Other Assets” on the balance sheet is primarily receivables (₹76.29 Cr) and cash (₹10.51 Cr). The ₹0.18 Cr net block suggests zero owned fixed assets—a trading model requires no factories, warehouses, or plant.

Three Observations:

Reserves flipped from ₹(17.02) Cr to ₹7.37 Cr in a single year through the injection of ₹30.68 Cr in share capital proceeds and ₹22 Cr in loan-to-equity conversion. The turnaround in net worth is paper-based (fresh capital), not operational.

Borrowings of ₹51 Cr now dwarf the prior year’s ₹2.12 Cr. The company took on leverage to fund working capital (the ₹76 Cr debtors on the asset side are financed by the ₹51 Cr debt plus equity). Metal trading at scale requires float.

Cash of ₹10.51 Cr is modest (1.75% of revenue). The bulk of the capital raise was deployed into receivables, not held as dry powder.


8 — Cash Flow: Sab Number Game Hai

YearOperatingInvestingFinancing
FY2025(0.13)0.000.13
FY2026(68.94)(9.67)30.62

Operating cash is negative ₹68.94 Cr because the receivables base expanded from ₹0 to ₹76 Cr. In accrual accounting, this is profit; in cash accounting, it’s a working capital drain. Investing activity (₹9.67 Cr outflow) is the fixed deposit purchase—a defensive move. Financing inflow of ₹30.62 Cr is the equity raise (₹30.68 Cr net) and new borrowing offset by interest paid (₹0.18 Cr in the consolidated flow).

Net cash declined ₹48 Cr. The cash balance fell from ₹0.16 Cr to approximately ₹10.51 Cr (a gain, but because the receivables-to-cash conversion hasn’t happened yet). The business is a cash consumer in year one; whether it becomes cash-generative depends on the speed of receivable conversion and whether margins hold.


9 — Ratios: Sexy or Stressy?

RatioValue
ROE36.4%
ROCE23.7%
P/E69.6x
PAT Margin1.03%
D/E1.41x

ROE of 36.4% is the return on ₹17.09 Cr average equity for ₹6.22 Cr net profit. The high return reflects two things: the equity base is compressed (still small), and the new capital was deployed only mid-year (time-weighted, not full-year return). This is a first-year, leverage-aided metric. Reversion downward is likely as the equity base normalizes post-warrant conversion.

ROCE of 23.7% is capital-employed return—what the underlying business (equity + debt) is yielding. For commodity steel trading, 24% is not unreasonable; it reflects the working capital intensity (you need to finance receivables) and the float inherent in the model. But margins are thin (1.03% PAT margin), so ROCE is primarily a leverage play, not an operational one.

P/E of 69.6x is the multiple applied to ₹2.15 earnings per share at ₹150 price. This is what the market is paying—not a verdict, but an observation. The company has no history (one profitable year), so the multiple is pure forward expectation.

D/E of 1.41x means the company is borrowing ₹1.41 for every rupee of equity. For a trading business, this is moderate; for a business with thin margins, it is leverage with edge exposure. Interest coverage (EBIT ÷ Interest) is 4.91x, adequate but not generous.


10 — P&L Breakdown: Show Me the Money

YearRevenueEBITDAPAT
FY20240.00(0.00)(0.13)
FY20250.00(0.00)(0.13)
FY2026601.185.976.22

The company went from a loss-making shell with ₹0 revenue to a ₹600+ Cr trading operation in twelve months. This is not organic growth; it is the acquisition of an existing business (Nidimo Mont) and its consolidation.

Revenue is the number shipped. EBITDA of ₹5.97 Cr is thin—a 0.99% EBITDA margin. PAT of ₹6.22 Cr sits above EBITDA because other income (₹5.73 Cr, mostly interest) offsets interest costs (₹2.11 Cr) and depreciation (₹0.03 Cr is immaterial). Strip out other income and underlying operating profit is ₹2.79 Cr. The business is profitable but fragile. A 1% slip in receivables realization or a 1% margin compression results in breakeven.


11 — Peer Comparison

CompanyRevenue (Qtr)PAT (Qtr)P/EROCE
MRF8044.22702.2522.1615.73
Balkrishna Inds2932.82299.4635.0512.38
Apollo Tyres7335.67630.9713.1713.82
CEAT4218.89243.8118.8618.74
JK Tyre & Indust4223.44177.9612.8515.52
TVS Srichakra980.9436.0943.957.54
Goodyear India616.289.6922.7917.40
Megamont286.603.5969.6523.72
Peer Median616.289.6922.1613.82

Megamont trades at 69.65x earnings versus a peer median of 22.16x. The ROCE of 23.72% sits above peers (median 13.82%), but the PAT margin is half the peer average. The quarterly revenue of ₹286.60 Cr (annualized ₹1,146 Cr run-rate) is in the middle of the peer set, but the profit per rupee of sales is lowest. The company is two-thirds the peer median size but priced as if it were three times cheaper on P/E than it actually is.


12 — Miscellaneous: Shareholding & Promoters

HolderStake (%)
Promoters58.55
DIIs1.26
Public40.19

Promoters: Minal Gaurav Patil (29.28%) and Mounica Maddukuri (29.28%) arrived via preferential allotment and open offer in late 2025. They acquired the entire holding of Faze Three Limited and other earlier promoters (Ajay Brijlal Anand, Rashmi Ajay Anand, Vishnu Ajay Anand) who held 30.16% at the start of FY26. The shift from distributed ownership (multiple families) to two concentrated principals (58.55%) signals a power consolidation and a new vision. This is not a vote of no confidence; this is a business being taken over.

Public: 40.19% are scattered retail investors. ICICI Bank maintains 1.26% through DII holdings. No institutional anchor from the original shareholder base.

A Small Roast: Two new whole-time directors, no auditor continuity (the prior auditor resigned in November 2025), three director resignations in October 2025—the governance churn is not reassuring, but it is also not unusual for a pivot. The question is whether the new team’s track record at Nidimo Mont (where it has operated for years) translates to public-company discipline. An unaudited partnership and a listed entity are different beasts.


13 — Corporate Governance: Angels or Devils?

Auditors: KPN & CO, Chartered Accountants (FRN: 133536W), issued an unmodified opinion on both standalone and consolidated results. The prior auditor, Thakur Vaidyanath Aiyar & Co, resigned on 12 November 2025, citing “pre-occupation.” Auditor churn is a flag in early-stage structures; however, the new auditor delivered a clean sign-off without qualifications.

Board: Two whole-time directors (Minal Patil as Chairperson, Mounica Maddukuri as WTD), one independent director, and one non-executive director. The EGM on 14 January 2026 approved multiple director appointments and an increase in borrowing limits from ₹10 Cr to ₹100 Cr (a 10x expansion that telegraphs aggressive debt-funded growth).

Related Party: Megamont extended an interest-free unsecured loan of ₹29.58 Cr to Nidimo Mont before converting ₹22 Cr into equity. This is a common-control transaction (the promoters held both entities), so there is no external creditor concern. But it is a reminder that the parent-subsidiary relationship is still intertwined.

Pledges: 0% pledged shares as of March 2026. The promoters’ stake is unencumbered (no collateral risk to lenders).

Tax: No outstanding income tax demands or credit action disclosures. The company has no history of losses to offset, so it will be a cash taxpayer going forward.

Resignations: Three company secretaries resigned within seven months in FY24. No such signal in FY26 (the fresh team appears stable post-January 2026 reset).


14 — Industry Roast & Macro Context

Steel trading in India is a volume game played at razor margins. Prices are set by global commodity indices; your margin is your logistics, your relationships, and your ability to move faster than the other guy. Megamont is operating in a sector where competition is fragmented (thousands of traders), pricing is transparent (LME and domestic benchmarks), and differentiation is a myth.

Shipping constraints, port fees, forex volatility, and buyer concentration (large institutional buyers dictate terms) are the realities. A margin compression of 50 basis points (from 1% to 0.5%) on a ₹600 Cr revenue base eliminates the entire ₹6 Cr profit. The business is profitable but brittle.

India’s steel consumption has grown at 4–5% annually. Export volumes have been volatile. The government’s focus on infrastructure (roads, railways, metro) has supported demand, but global oversupply (China, Vietnam, Russia) keeps prices flat. For a distributor, the tailwind is growth in construction and automotive; the headwind is commodity-price deflation.

Tariffs and trade policy matter. Recent anti-dumping duties and safeguard measures have created pockets of protected domestic pricing, favoring Indian traders. But these are cyclical and geopolitical. A resurgent global supply or a shift in tariff policy flips the dynamic instantly.


15 — EduInvesting Verdict

SWOT:

StrengthsRapid revenue ramp-up (₹0 to ₹601 Cr in one year); positive EBITDA and PAT in year one; ROE and ROCE metrics above peer average; promoter conviction (58.55% stake taken at ₹22, stock now at ₹150).
WeaknessesRazor-thin operating margins (0.77%); negative operating cash flow in year one; no fixed asset base or barriers to entry; working capital intensity; auditor churn and governance flux in FY26.
OpportunitiesInfrastructure expansion in India; EV supply-chain demand (steel for battery housings, drivetrains); export opportunities if tariff tailwinds persist; scale efficiencies if the business reaches ₹1,000+ Cr revenue.
ThreatsCommodity price deflation; buyer insolvency (concentration risk in debtors); leverage pressure if margins slip; warrant dilution (44.8 Cr shares at ₹22, a 1,550% overhang); recession drying up construction and automotive demand.

Closing Thought

Megamont is a trading company that arrived on the market as a renamed shell and now sits at a 69.6x P/E, priced on the confidence that the promoters can scale Nidimo Mont’s 0.77% margins into something defensible. The balance sheet is clean, the cash flow is real (even if negative), and the profit is genuine (one profitable year proves that). But the market is not pricing this as a commodity trader; it is pricing it as a turnaround or a growth story. The data suggests otherwise—it is a trading business with operational metrics consistent with its peer set, not above it. The stock’s performance since the open offer (from ₹22 to ₹150) is a function of promoter conviction and retail momentum, not a revelation in the numbers. A balance sheet with nothing to hide, a multiple with everything to prove.