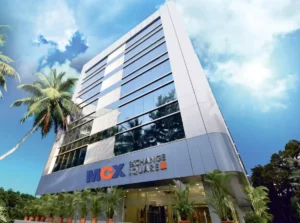
At a Glance
Multi Commodity Exchange of India Ltd (MCX) just dropped a blockbuster Q1 FY26 with revenue ₹405.8 crore (+60% YoY) and PAT ₹203.2 crore (+83% YoY). Operating margin stood at a jaw-dropping 65%, making other financial service firms look like they’re selling lemonade. The cherry on top? The board approved a 1:5 stock split, giving retail investors something to cheer about (even if it’s just psychological). Yet, with a P/E of 59, buying MCX feels like ordering gold at jewelry store rates – pure premium.
Introduction
MCX is India’s undisputed king of commodity derivatives, a monopoly so secure that its only competitor (NCDEX) barely registers on the map. With 95.9% market share, MCX practically controls price discovery for metals, energy, and precious commodities – except agriculture, where it only has 2.6% share (farmers don’t gamble much, apparently).
The past year saw MCX stock rally like crude oil during a supply cut, climbing 73% YoY. But investors now wonder: Is this the top? Or just the beginning of another commodity supercycle of profits?
Business Model (WTF Do They Even Do?)
MCX is not a trader. It’s the platform where traders and hedgers meet to play with futures & options on commodities. The company earns from transaction fees (like a toll booth, but for trades), data services, and annual membership fees. With SEBI regulating, there’s no threat of new entrants eating into MCX’s pie anytime soon.
- Market Share: 95.9% in commodities futures
- Energy & Metals: >99% share
- Agricultural Commodities: negligible
The exchange thrives on volumes – more volatility = more trades = more money. Simple, profitable, and beautifully boring.
Financials Overview
Q1 FY26 Results
- Revenue: ₹405.8 crore (+60% YoY)
- EBITDA: ₹241 crore (EBITDA Margin 65%)
- PAT: ₹203.2 crore (+83% YoY)
- EPS: ₹39.8 (pre-split)
FY25 Full Year
- Revenue: ₹1,113 crore
- PAT: ₹560 crore
- OPM: 60%
- PAT Margin: 44.7%
Commentary: Profitability is soaring with record trading volumes in metals and energy. This is what happens when you’re a monopoly – you just print cash.
Valuation
Time to crunch the numbers, Buffett style:
- P/E Method
- TTM EPS: ₹127.9
- Sector P/E: ~40
- Fair Value: ₹5,000–₹6,500
- EV/EBITDA Method
- EV/EBITDA: 30x (premium justified by monopoly)
- EBITDA: ₹774 crore
- EV ≈ ₹23,000 crore → per share value ≈ ₹6,500–₹7,000
- DCF (Quick)
- Assume 15% growth, 10% discount
- Fair Value ≈ ₹6,800–₹7,500
Final Range: ₹6,500–₹7,500 (current ₹7,596 = slightly overheated).
What’s Cooking – News, Triggers, Drama
- Stock Split 1:5: Board approved, subject to approvals – expect retail frenzy.
- Volume Surge: Global commodity volatility boosting trades.
- Tech Upgrade: Improved trading platforms attracting new participants.
- Regulatory Overhang: SEBI loves to keep exchanges on a short leash.
Balance Sheet
| (₹ Cr) | Mar 2025 |
|---|---|
| Assets | 4,325 |
| Liabilities | 2,441 |
| Net Worth | 1,884 |
| Borrowings | 1 (virtually zero) |
Remarks: Auditor: “Debt? Which debt? They’re basically debt allergic.”
Cash Flow – Sab Number Game Hai
| (₹ Cr) | Mar 2023 | Mar 2024 | Mar 2025 |
|---|---|---|---|
| Operating | 141 | 521 | 950 |
| Investing | -8 | -424 | -751 |
| Financing | -89 | -98 | -40 |
Remarks: Operating cash flow is gushing like oil in Texas; investments show they’re putting money back into business.
Ratios – Sexy or Stressy?
| Metric | Value |
|---|---|
| ROE | 34.3% |
| ROCE | 42.9% |
| P/E | 59.4 |
| PAT Margin | 52% |
| D/E | 0.00 |
Remarks: Ratios are a supermodel – high ROE, no debt. The only “stress” is the valuation multiple.
P&L Breakdown – Show Me the Money
| (₹ Cr) | FY23 | FY24 | FY25 |
|---|---|---|---|
| Revenue | 514 | 684 | 1,113 |
| EBITDA | 145 | 63 | 665 |
| PAT | 149 | 83 | 560 |
Remarks: FY24 had a tech cost hiccup, but FY25 rebounded spectacularly.
Peer Comparison
| Company | Revenue (₹ Cr) | PAT (₹ Cr) | P/E |
|---|---|---|---|
| BSE | 3,212 | 1,389 | 70.5 |
| IEX | 552 | 434 | 27.1 |
| MCX | 1,252 | 652 | 59.4 |
Remarks: MCX is expensive, but so is monopoly power. BSE trades higher P/E due to equities frenzy.
Miscellaneous – Shareholding, Promoters
- Promoters: 0% (MCX has no promoter, public holding structure)
- FIIs: 21.7% (steady)
- DIIs: 59.1% (institutional love)
- Public: 19% (retail crowd waiting for the split to pounce)
EduInvesting Verdict™
MCX is the RBI of commodity trading – everything flows through it. Profits are soaring, margins enviable, and debt non-existent. However, at P/E near 60, it’s priced like a luxury good. Stock split could fuel short-term rally, but long-term investors must ask: How much premium is too much for a monopoly?
SWOT Analysis
- Strengths: Market dominance, high margins, cash-rich, SEBI-backed.
- Weaknesses: Over-reliance on volume trends, tech glitches hurt margins.
- Opportunities: Commodity supercycle, new derivatives, global expansion.
- Threats: Regulatory tightening, competition from new platforms.
Final Word: MCX is a gold standard monopoly – great business, strong financials. But with valuations this high, investors may need nerves of steel (or at least a hedging strategy).
Written by EduInvesting Team | August 02, 2025
SEO Tags: MCX Q1 FY26 Results, Multi Commodity Exchange Analysis, Commodity Market Stocks, Indian Exchange Stocks


