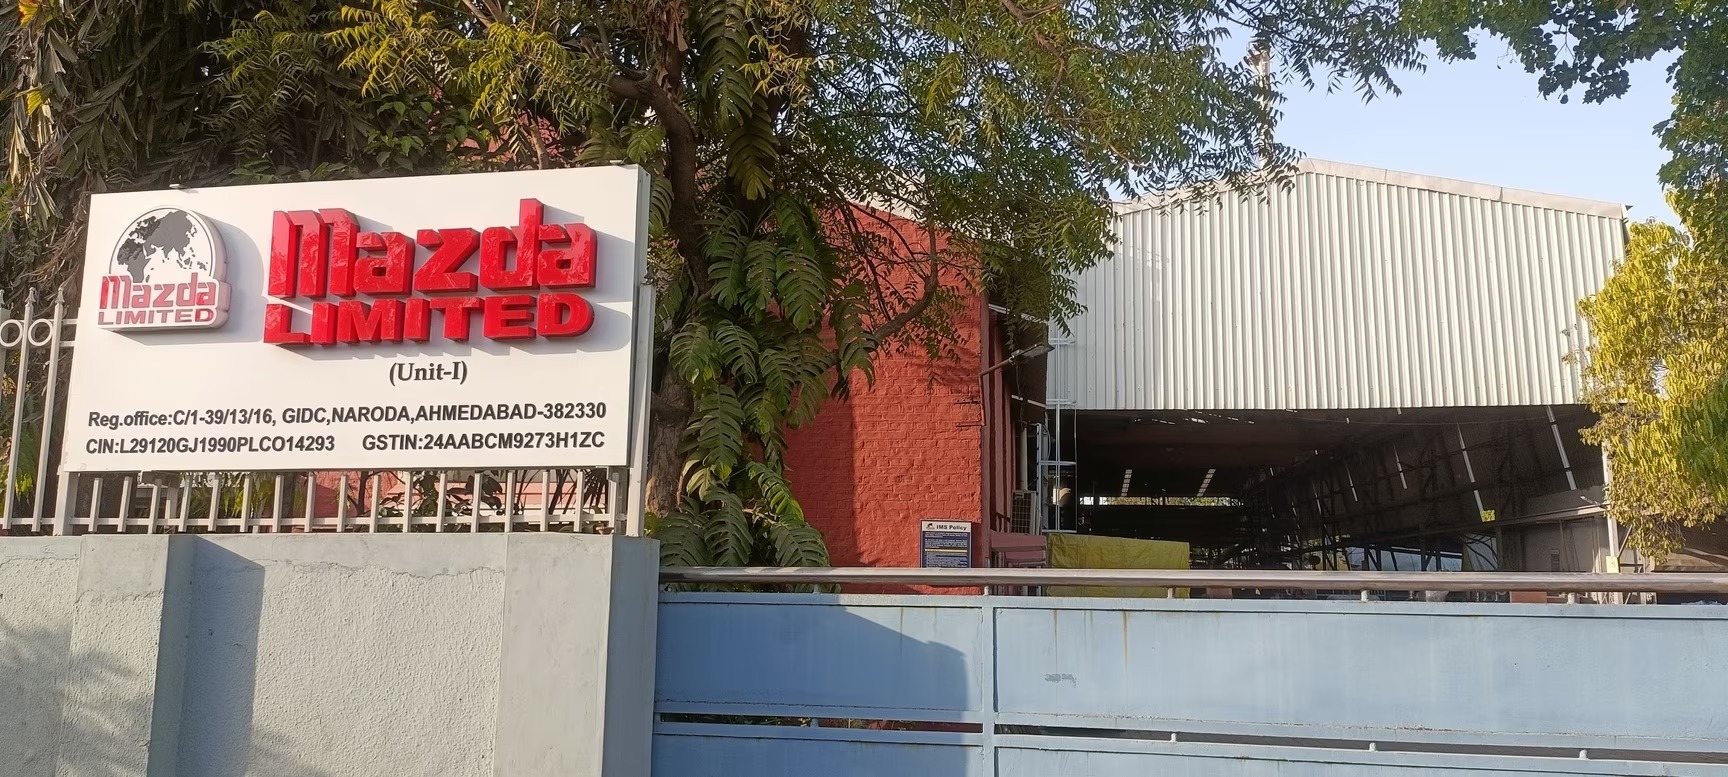
Mazda Limited FY26: A ₹92 Cr Export Contract Meets a Ballooning Inventory Problem
Spotted a factual error — a wrong number, date, or fact? Tell us and we will check the source.
General information and entertainment, not investment advice. The author is not a SEBI-registered adviser or research analyst. No recommendation, no promised returns. Markets carry risk including loss of capital. Figures may not be current. Consult a registered adviser before acting.
1. At a Glance
Mazda shipped ₹212 Cr in sales for FY26, a modest recovery from FY25’s dip.
Net profit landed at ₹27.5 Cr—up 11% year-on-year, though the path there was uneven (Q2 was a writeoff at ₹2.9 Cr net profit).
The real story sits in two places: a ₹92 Cr export order for Riyadh’s King Salman Park project, promised for delivery by end of H2 FY27, and an inventory pile-up that swelled to ₹98 Cr from ₹44 Cr in just two years.
The company holds zero debt, ₹249 Cr in net worth, and squeezed out negative free cash flow of ₹43 Cr in FY26 as cash drained into that inventory monster.
Market prices the stock at 17x trailing earnings, a discount to its peer median of 32x—though peers are thrice the size and 5x as profitable.
One big order doesn’t fix a working capital problem. Execution matters now.
2. Introduction
Mazda Limited is a thirty-year-old engineering equipment manufacturer with a split personality: 91% vacuum systems, evaporators, and pollution kit for refineries and chemicals; 9% food products (jams, powders, colours) under the B-Cool brand.
The vacuum business is bespoke. Repeat customers (Siemens, Vedanta, Adani Wilmar, Triveni Turbines) lock in engineers and relationships, not price wars.
The company trades in Ahmedabad, operates five plants, exports to 40+ countries.
FY26 saw management secure the largest order in its history: ₹92 Cr (USD 11.6M) for King Salman Park in Riyadh, a Saudi-government climate control project. Execution window: next 12 months.
Last dividend recommended: ₹4 per share (200% payout), subject to AGM approval—signal of confidence in the bank balance, if not the balance sheet structure.
3. Business Model: WTF Do They Even Do?
Mazda makes precision industrial kit: evaporators (cooling and concentration), vacuum systems (thin-film distillation, degassing), condensers, heaters, pollution gear. Customers spec it, Mazda engineers it, delivers it, then moves on.
The end-user depends on capex cycles. When a pharma or refinery has surplus cash and thinks “let’s upgrade emissions,” Mazda gets the call. When capex freezes, so does Mazda’s pipeline.
Vacuum systems alone run 38% of revenue; evaporators another 25%. Both are sticky businesses—once installed, spares and upgrades follow. But the initial sale is lumpy and depends on when the buyer’s CFO releases the budget.
The food division (B-Cool) is a joke in revenue terms, 9% of the pile. Jams and food colour in a market thick with unbranded players. Management says H2 FY27 will see new product launches. No track record of scale here yet.
Geographically, domestic is 77%, export 23%—stable. The Riyadh order, if it converts, swings that ratio.
Manufacturing footprint: five plants in Ahmedabad. No capex splurge announced beyond the ₹0.01 Cr CWIP sitting on the books. The Riyadh order will be made in-house; capacity exists.
4. Financials Overview
Figures are consolidated, in ₹ crore.
Metric
FY26
YoY
FY25
Revenue
212.05
+9.8%
193.26
EBITDA
38.36
+1.2%
37.89
PAT
27.51
+10.7%
24.85
EPS
13.76
+10.6%
12.43
Q4 FY26 fired on time. Sales ₹64.2 Cr, net profit ₹6.3 Cr (19.9% YoY growth in top line, 13.1% in bottom). EPS that quarter: ₹3.14.
But the quarter mask the year’s pain. Q2 was a dud—₹37 Cr sales collapsed into ₹2.9 Cr net profit (7.8% margin, versus usual 10–16%). Management offered no public explanation; likely a lumpy project delivery schedule.
EBITDA margin sat at 18.1% for FY26 (operating profit ₹34 Cr + depreciation ₹4.2 Cr = ₹38.2 Cr ÷ ₹212 Cr revenue). That’s healthier than FY25’s margin (19.6%), a sign the sales bump didn’t come with pricing power—cost pressures absorbed the growth.
Interest expense was negligible (₹1 Cr for the year), confirming zero meaningful debt. Tax rate hovered at 24.3%.
5. Market Expectations & Historical Multiples
This section describes how the market is currently pricing the company and how that compares with its own history and peer group. It is descriptive, not predictive.
Metric
Current
Historical 5-Yr Avg
Peer Median
P/E
16.9x
19.5x
31.8x
EV/EBITDA
12.2x
14.1x
18.3x
ROE
11.5%
12.7%
14.2%
ROCE
15.6%
16.8%
14.4%
P/B
1.87x
2.1x
2.4x
The market currently pays ₹16.9 per rupee of trailing earnings, against its five-year average of 19.5x and a peer band (Honeywell Auto, Syrma SGS, Jyoti CNC) at 31.8x.
The discount reflects the company’s scale lag. Peers by revenue: Honeywell (₹11,800 Cr), Aditya Infotech (₹14,220 Cr), Syrma (₹14,650 Cr). Mazda: ₹212 Cr. The peer median P/E anchors on giants with 29x earnings yields; Mazda’s structural size gap justifies the haircut, not exceptional cheap-ness.
ROCE (15.6%) sits above the peer median (14.4%), an artifact of Mazda’s modest capital base—high returns on a small net worth base can flip fast if capex surges or returns compress. The ratio favours