1. At a Glance
Mazagon Dock’s Q1 FY26 numbers sailed in with mixed tides: Revenue ₹2,626 Cr (-15% QoQ, +21% YoY) and PAT ₹452 Cr (+35% QoQ from ₹325 Cr, -44% YoY from ₹807 Cr). Operating margin at 11% shows shipbuilding is not as smooth as its hulls.
2. Introduction
Think of Mazagon Dock as the Navy’s favorite child that occasionally forgets to do its homework. Revenue came in strong compared to last year, but margins keep wobbling. Order books remain hefty, but P/E 52 means investors expect a battleship, not a leaking boat.
3. Business Model (WTF Do They Even Do?)
Mazagon Dock builds and repairs:
- Warships – destroyers, frigates, corvettes.
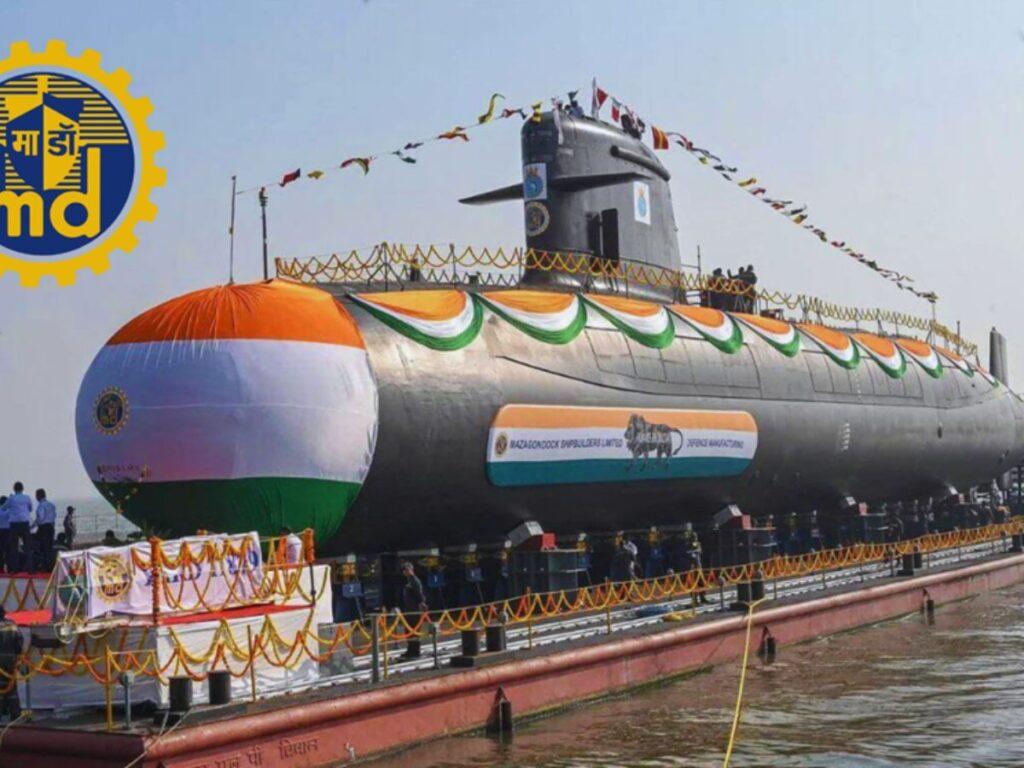
- Submarines – including Scorpene-class.
- Commercial Vessels – offshore platforms, passenger ships.
99% of orders come from the Indian Navy; occasional exports for brownie points.
4. Financials Overview
Q1 FY26 Snapshot:
- Revenue: ₹2,626 Cr (-16% QoQ, +11% YoY)
- Operating Profit: ₹302 Cr (OPM 11%)
- PAT: ₹452 Cr (+39% QoQ, -44% YoY)
- EPS: ₹11.21
Verdict: Revenue healthy, margins bleeding from cost overruns.
5. Valuation – What’s This Stock Worth?
Current P/E 51.9 is priced like a stealth submarine. Using FY26E EPS ~₹55, applying a saner 35–40x multiple, fair value range is ₹2,000–₹2,200. Current ₹2,790 is where expectations outpace delivery.
6. What-If Scenarios
- If high-value orders execute smoothly: EPS sails past ₹60, stock holds ₹3,000+.
- If cost overruns persist: EPS sinks, stock drifts near ₹2,200.
- If submarine exports finalize: Re-rating story begins.
- If defense budget delays: Ship stuck in dry dock.
7. What’s Cooking (SWOT Analysis)
Strengths: Monopoly in naval shipbuilding, PSU safety, strong order book, Navratna status.
Weaknesses: Lumpy revenue, dependency on MoD, thin margins.
Opportunities: P75(I) submarine bid, global defense tie-ups.
Threats: Cost escalations, project delays, competition from private shipyards.
8. Balance Sheet 💰
| ₹ Cr | FY23 | FY24 | FY25 |
|---|---|---|---|
| Assets | 29,773 | 29,463 | 28,708 |
| Net Worth | 4,558 | 6,042 | 7,738 |
| Debt | 6 | 1 | 20 |
| Liabilities | 24,709 | 23,219 | 20,748 |
Comment: Debt negligible, but contingent liabilities ₹37,139 Cr loom.
9. Cash Flow (FY23–FY25)
| ₹ Cr | FY23 | FY24 | FY25 |
|---|---|---|---|
| Ops | -163 | 1,516 | 684 |
| Investing | 326 | -150 | 1,420 |
| Financing | -183 | -218 | -448 |
| Net Cash | -19 | 1,148 | 1,655 |
Positive cash in FY25, thanks to project payments.
10. Ratios – Sexy or Stressy?
| Ratio | FY23 | FY24 | FY25 |
|---|---|---|---|
| ROE (%) | 32 | 34 | 34 |
| ROCE (%) | 33 | 44 | 43 |
| PAT Margin (%) | 14 | 21 | 18 |
| CMP/BV | 47 | 14 | 14.2 |
ROE sizzling, but CMP/BV screams expensive.
11. P&L Breakdown – Show Me the Money
| ₹ Cr | FY23 | FY24 | FY25 |
|---|---|---|---|
| Revenue | 7,827 | 9,467 | 11,432 |
| EBITDA | 801 | 1,416 | 2,060 |
| PAT | 1,119 | 1,937 | 2,414 |
Growth impressive, but FY26 margins waver.
12. Peer Comparison
| Company | P/E | ROE% | OPM% | PAT Qtr Cr |
|---|---|---|---|---|
| Mazagon Dock | 51.9 | 34 | 14.7 | 452 |
| Cochin Shipyard | 54.7 | 15.9 | 19.3 | 285 |
| Swan Defence | — | -46 | — | -23 |
Mazagon trades like a premium warship in a sea of fishing boats.
13. EduInvesting Verdict™
Mazagon Dock is a defense gem with a fat order book and PSU stability, but Q1 FY26 shows the profit engine stuttering. Valuation is already priced for perfection. Any delay or cost spike could sink near-term sentiment.
A sturdy battleship – but the market’s paying battleship price for a frigate quarter.
Written by EduInvesting Team | 28 July 2025
Tags: Mazagon Dock, Q1 FY26, ₹2,626 Cr Revenue, ₹452 Cr PAT, EduInvesting Premium