1. At a Glance – Operation ICU (Investor Curiosity Unit)
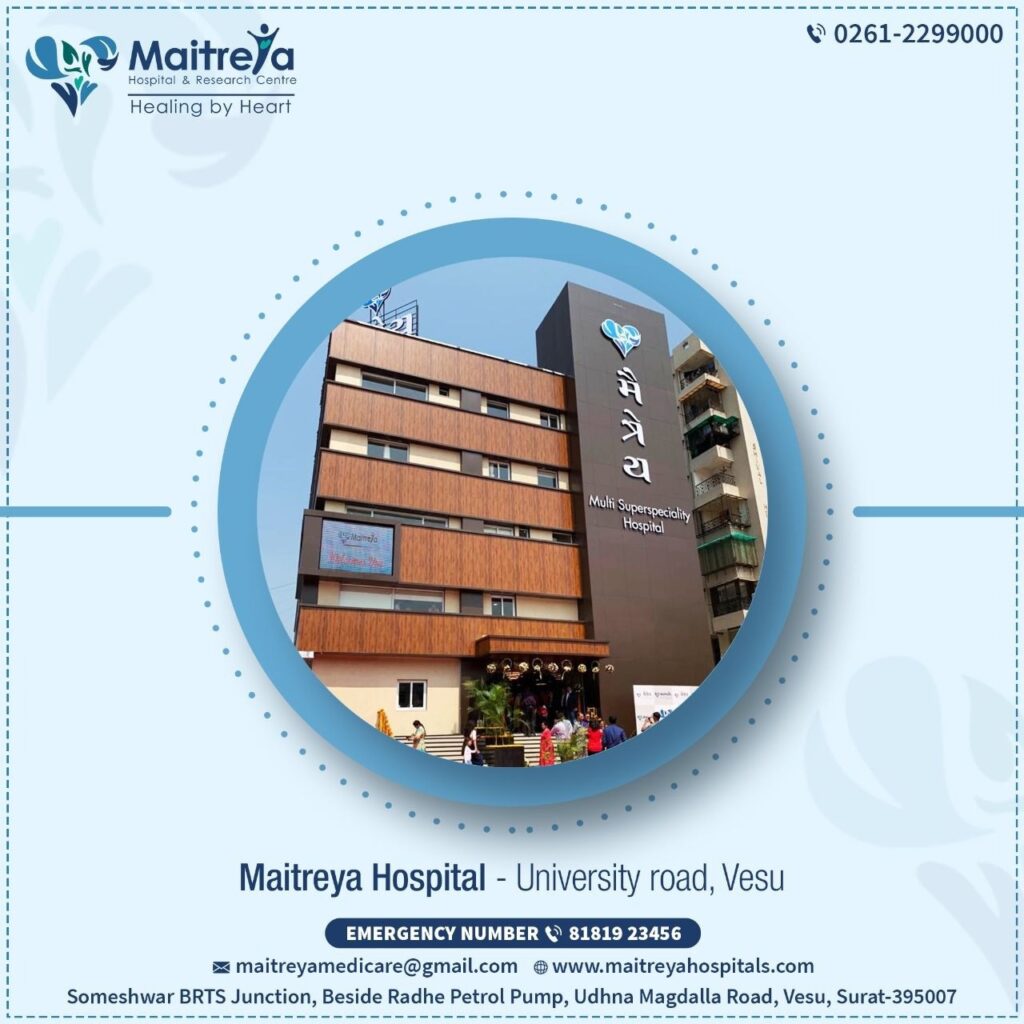
Maitreya Medicare Ltd is that ambitious Surat-based hospital chain that woke up one day and said, “Why stop at one hospital when you can manage half a city’s healthcare?” Incorporated in 2019, listed on NSE SME, current price hovering around ₹229, market cap roughly ₹155 Cr, and a stock P/E so astronomical (≈970) that even Apollo Hospitals would raise an eyebrow and check the prescription twice. Over the last three months, the stock politely declined by ~6.5%, and over one year it has punished patience with a ~33% fall. Latest half-yearly sales came in at ₹23.7 Cr, while PAT slipped into negative territory at ₹-0.04 Cr for the latest reported period. ROCE sits at 10.8%, ROE at 7.17%, debt is low at ₹4.28 Cr, and promoter holding is a confident 73%. On paper, this looks like a hospital chain still in physiotherapy mode — learning to walk profitably while sprinting on expansion announcements. Curious yet? Good. That’s exactly how this stock wants you to feel.
2. Introduction – From One Hospital to “Sabka Doctor”
Maitreya Medicare is not your sleepy, single-building hospital with faded OPD boards and one overworked MRI machine. This company has ambition. Since 2019, it has aggressively expanded from a single 67-bed hospital in Surat to a network boasting 555 beds across owned hospitals, subsidiaries, and O&M-managed facilities.
But ambition and execution don’t always arrive in the same ambulance.
On one hand, Maitreya operates across 18+ specialties — cardiology, oncology, neurosurgery, dialysis, orthopedics, and enough “-logy” departments to make a biology student nervous. On the other hand, its financials show thin margins, volatile profits, and a valuation that seems to be pricing in a future where every bed is occupied, every doctor is overworked, and every patient pays on time.
The company’s stated bed occupancy is ~55%, with dreams of reaching 100% by FY26. That’s not a forecast; that’s a wish whispered to the ICU ceiling at 3 a.m. Expansion has been rapid: Mumbai, Surat, Valsad, Varanasi — if there’s a Tier 2 city with underutilized hospital infrastructure, Maitreya wants to manage it.
So the big question: is this a classic healthcare growth story still early in its lifecycle, or a case of “pehle beds badhao, baad mein margins dekhenge”? Keep reading, doctor saab.
3. Business Model – WTF Do They Even Do?
Let’s simplify this without prescribing unnecessary jargon.
Maitreya Medicare runs hospitals. Some it owns outright, some through subsidiaries, and many via Operation & Management (O&M) agreements. This is crucial. Instead of spending hundreds of crores building hospitals brick by brick, Maitreya often walks into existing hospitals and says, “Tum building do, hum management denge.”
This asset-light-ish model helps them expand bed capacity quickly without loading the balance sheet with debt-heavy real estate. In theory, it’s smart. In practice, it means margins depend heavily on execution quality, doctor retention, patient mix, and how efficiently they can ramp up occupancy.
Revenue is earned from:
In-patient and out-patient services
Diagnostics and procedures
Specialty surgeries (high ARPOB)
Dialysis and critical care
Average Revenue Per Occupied Bed (ARPOB) stands at ₹28,041, which is decent for Tier 2/Tier 3 focused hospitals, though not metro luxury-hospital territory.
Their growth playbook is simple:
Enter underpenetrated cities
Add beds fast via partnerships
Improve utilization over time
Pray margins follow
Will they? That’s the suspense thriller we’re watching.
4. Financials Overview – The Vital Signs Table
Result Type Locked: The latest official result header clearly states “Half Yearly Results”. 👉 EPS annualisation will therefore be latest EPS × 2. Lock applied. No further debate.
Consolidated Financial Comparison (₹ Cr)
Metric
Latest H1 (Sep 2025)
Same Period Last Year (Sep 2024)
Previous Period (Mar 2025)
YoY %
QoQ %
Revenue
23.70
24.36
22.30
-2.71%
6.28%
EBITDA
1.04
3.18
1.68
-67.3%
-38.1%
PAT
-0.04
1.67
0.20
-102.4%
-120%
EPS (₹)
-0.06
2.46
0.30
-102.4%
-120%
Annualised EPS (Half-Yearly): -0.06 × 2 = -0.12
Yes, that’s negative. No sugarcoating.
Commentary: Revenue is flat-ish, EBITDA margins are shrinking faster than patience in an OPD queue, and PAT just slipped on a banana peel called “one-time bad debt” (₹1.70 Cr, as per investor presentation). Without that, numbers would look less dramatic — but bad debts are still real debts, boss.
Question for you: should investors ignore one-offs, or treat them as symptoms?