General information and entertainment, not investment advice. The author is not a SEBI-registered adviser or research analyst. No recommendation, no promised returns. Markets carry risk including loss of capital. Figures may not be current. Consult a registered adviser before acting.
1 — At a Glance
Madhav Infra Projects closed FY26 with revenue of ₹502 crore, down 17.7% from the prior year’s ₹610 crore. Profit after tax moved the other way, rising 6% to ₹27.4 crore. A company that sells less and earns more in the same year is worth reading carefully, because the story usually lives in the mix, not the headline.
The operating margin firmed from 11% to 13%, and the reported EPS ticked up to ₹1.02 from ₹0.96. The market prices all of this at 8.5x earnings against an industry multiple of 17.5x and a peer median near 17.6x — a company sitting at roughly half the group’s multiple.
Underneath the numbers sit some things a reader notices at a second glance: contingent liabilities of ₹306 crore against a net worth of ₹240 crore, an order book concentrated in two states, a Company Secretary who resigned in May 2026 over deducted salary, and a secretarial report flagging website and insider-trading compliance gaps. A construction firm’s profit is a story about working capital, and working capital is a story about who is minding the books. The rest of this entry follows both threads.
2 — Introduction
Madhav Infra Projects is a Vadodara-based engineering, procurement and construction (EPC) contractor, incorporated in 2010 and the in-house EPC arm of the Madhav group. It builds roads, bridges, railway overbridges and elevated corridors, largely across Madhya Pradesh and Gujarat, and it develops and operates solar power projects. The promoters, Ashok Khurana and his son Amit Khurana, were the erstwhile promoters of MSK Projects India, later taken over by the Welspun group.
The recent years read as a pivot toward solar EPC. Per CARE’s rating report, FY25 revenue jumped ~60% on the back of high-value solar EPC execution, though those projects carry thinner margins than the group’s road work. FY26 then gave the revenue back — down to ₹502 crore — while profit held and margins recovered.
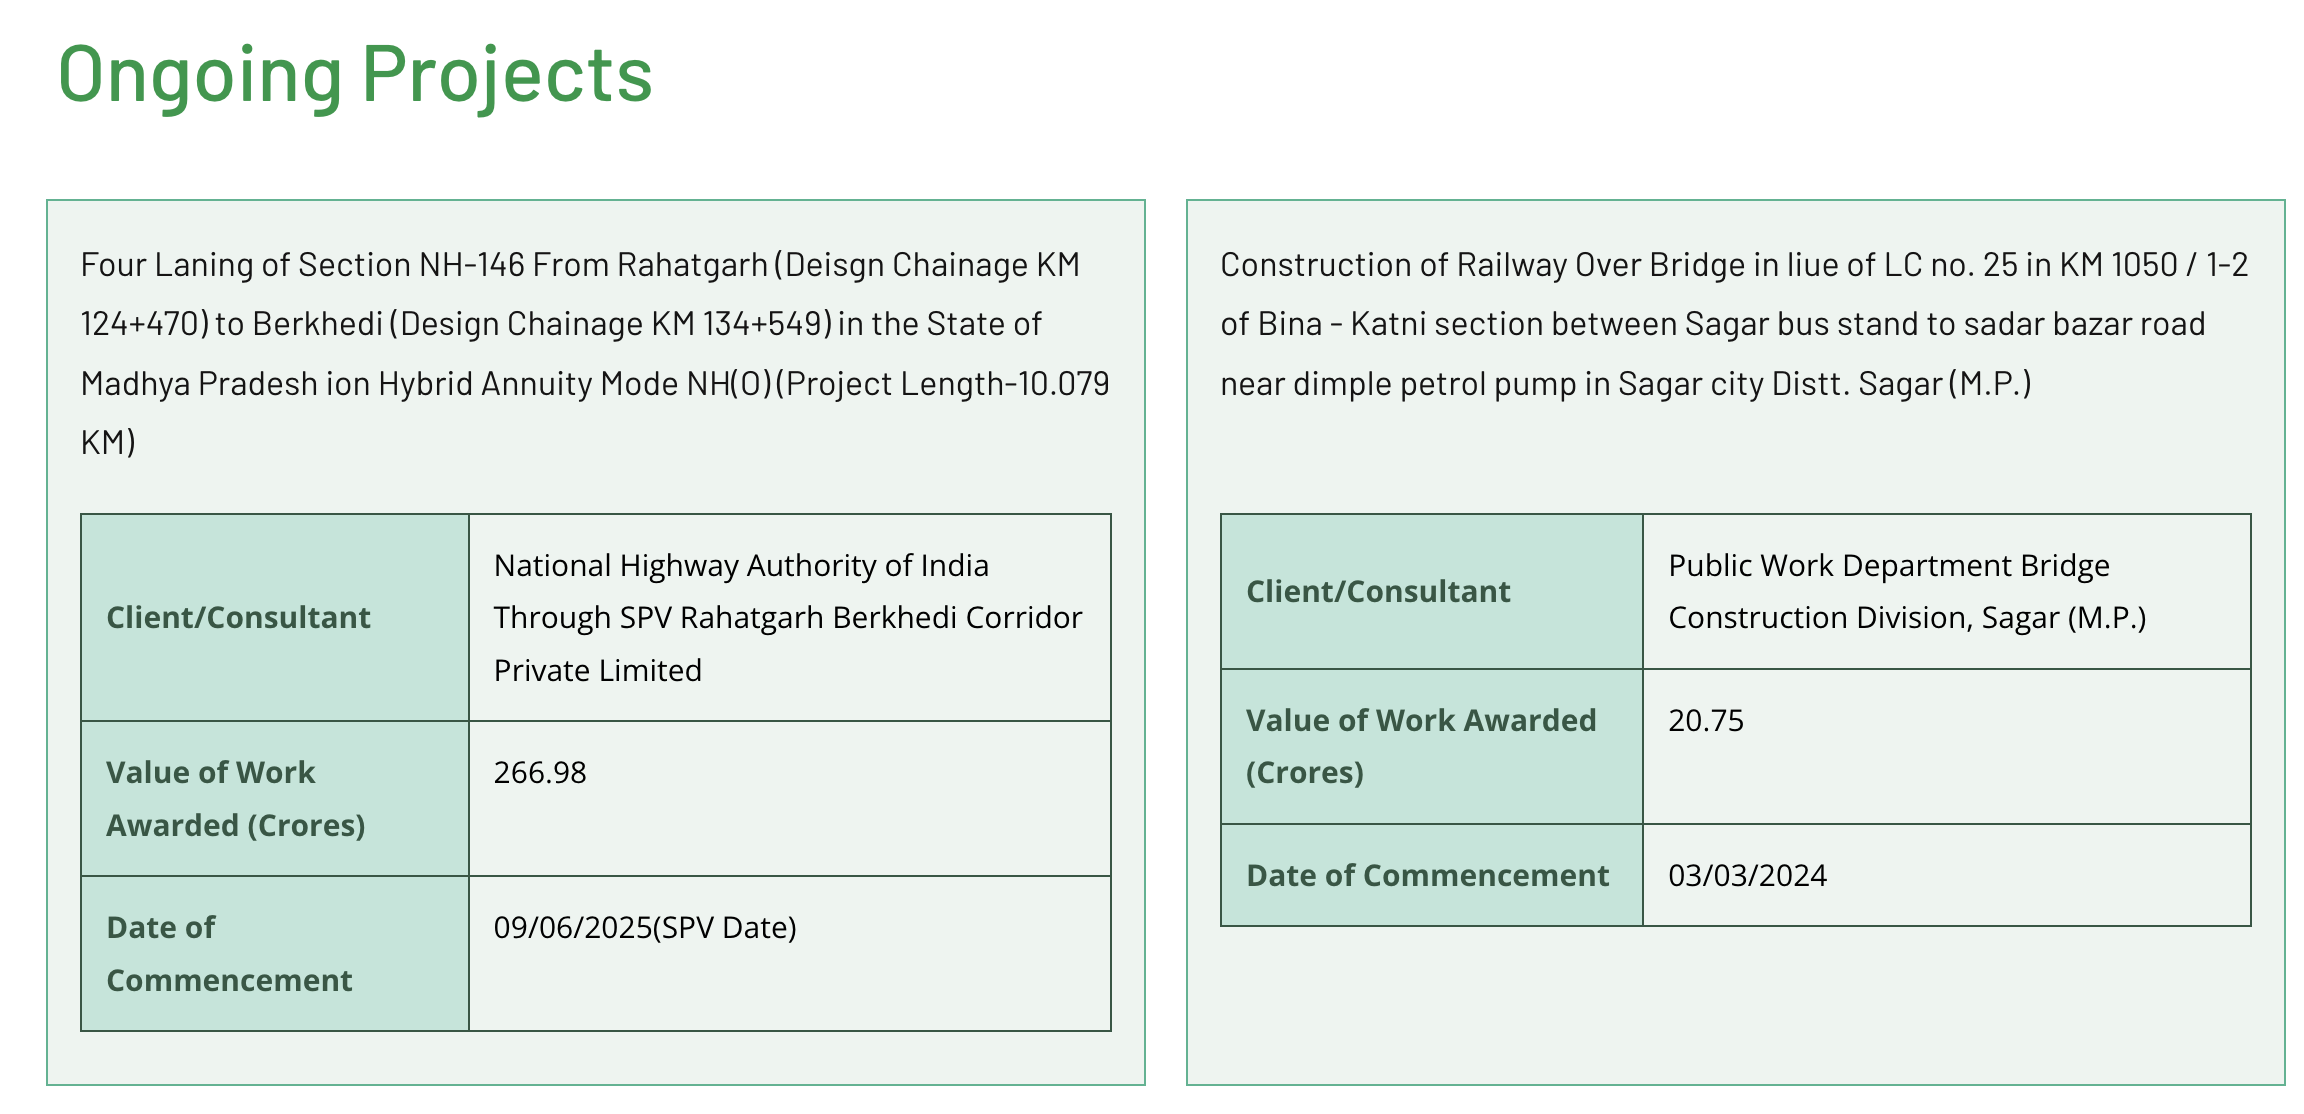
Recent moves cluster around solar. In April 2025 the company received a National Highways Authority letter of award for the NH-146 project worth ₹323.82 crore, and separately announced the acquisition of a 100% stake in MSK Projects. Through late 2025 and early 2026 it stacked up solar mandates from Madhya Pradesh government entities, incorporated nine wholly-owned SPVs in January 2026, and in April 2026 executed nine power purchase agreements for 73.15 MW of solar capacity.
3 — Business Model: WTF Do They Even Do?
Two segments, wildly lopsided. Infrastructure is essentially the whole company — 99% of revenue in FY24 versus 97% in FY22 — and energy (solar and hydro) is the rounding error that keeps growing anyway. The company itself notes power generation revenue runs under 10% of the main segment, which is why it treats the whole operation as a single reporting segment.
The infrastructure work is the classic government-contractor arrangement: win a tender, build a road or a railway overbridge, either directly or through a special-purpose vehicle under a concession agreement, then move to the next bid. The energy side offers solar as a service — viability studies, execution, supply, commissioning, and O&M — plus a modest solar EPC and O&M portfolio of around 119 MW across Karnataka, Punjab, Gujarat and Madhya Pradesh, and two hydropower projects totalling 6.8 MW.
The structural feature worth naming: this is a working-capital-intensive business bidding in what CARE describes as an intensely competitive and fragmented construction industry, where projects go to the most attractive bid price. That combination — aggressive bidding to win, then a long cash cycle to execute — is the entire margin puzzle of the sector. It also explains why a firm doing half a billion rupees in revenue holds receivables of ₹109 crore and inventory of ₹72 crore at year-end. The business doesn’t sell products; it finances them until the government pays.
The consolidated entity spans fifteen subsidiaries, one associate, and six joint ventures. For a ₹233 crore company, that is a lot of legal boxes to keep in a row.
Does a firm that pivoted into low-margin solar to grow revenue, then shed that revenue to protect margin, know which lever it wants to pull?
4 — Financials Overview
Figures are consolidated, in ₹ crore.
| Metric | FY26 | YoY | FY25 |
|---|---|---|---|
| Revenue | 502 | −17.7% | 610 |
| Operating Profit | 66 | −1.5% | 67 |
| PAT | 27.4 | +6.0% | 25.9 |
| EPS (₹) | 1.02 | +6.3% | 0.96 |
The headline tension is right here: revenue dropped a fifth, operating profit barely moved, and profit rose. The operating margin did the work, widening from about 11% to 13% — the figure sits on the data sheet. Per CARE, FY25’s growth came from solar EPC projects that carry lower profitability, so a smaller FY26 with less of that low-margin work landing produced a healthier margin. The audited results carried an unmodified opinion from statutory auditor Shah & Kadam.

5 — Market Expectations & Historical Multiples
This section describes how the market is currently pricing the company and how that compares with its own history and peer group. It is descriptive, not predictive.
| Metric | Current | Historical Average | Peer Median |
|---|---|---|---|
| P/E | 8.5x | — | 17.6x |
| P/B | 0.97x | — | — |
| EV/EBITDA | 4.19x | — | — |
| ROE | 12.1% | 11.7% (5-yr) | — |
| ROCE | 15.6% | — | 14.8% |
The market currently pays 8.5x earnings here versus a peer median of 17.6x. It prices the company at 0.97x book value — below the accounting value of its equity. The ROE of 12.1% sits close to its own five-year average of 11.7%, and the ROCE of 15.6% runs slightly above the peer median of 14.8%.
What the market appears to be pricing in is the sector’s structural drag rather than the company’s returns: a working-capital-intensive model, a geographically concentrated order book (around 93% in Madhya Pradesh and Gujarat, per CARE), contingent liabilities of ₹306 crore exceeding net worth, and the governance items flagged this year. A low multiple on a company whose returns roughly match its peers is the market weighing the balance sheet and the paperwork against the earnings. One factual observation on expectations: the multiple is set well below the peer band while the return metrics are not.
6 — What’s Cooking
Solar orders, mostly. In December 2025 the company received letters of award from M.P. Urja Vikas Nigam for grid-connected solar projects worth approximately ₹342 crore, with an 18-month execution period. In January 2026 it incorporated nine wholly-owned SPVs, each with paid-up capital of ₹1,00,000, to house MPUVNL projects. In April 2026 it executed nine power purchase agreements with Madhya Pradesh Power Management Company for 73.15 MW under the PM-KUSUM C feeder-solarisation scheme, selling power at a tariff of ₹2.71 to ₹2.73 per unit over a 25-year tenure.
On the corporate side, the May 29, 2026 board meeting approved the FY26 audited results, re-appointed the internal and cost auditors, and accepted the resignation of the Company Secretary. That last item has its own section.
7 — Balance Sheet
| Item | FY24 | FY25 | FY26 |
|---|---|---|---|
| Total Assets | 501 | 647 | 606 |
| Net Worth | 188 | 213 | 240 |
| Borrowings | 153 | 160 | 165 |
| Other Liabilities | 159 | 274 | 201 |
| Total Liabilities | 501 | 647 | 606 |
Assets equal liabilities in every column.
- Net worth has climbed every year — ₹188 crore to ₹240 crore — because a firm that pays zero dividend keeps every rupee of profit in reserves. The equity is compounding by default.
- Borrowings have crept from ₹153 crore to ₹165 crore, small in isolation, but CARE flagged that FY25’s overall gearing rose to 1.14x from 0.74x on increased working-capital borrowing.
- Other Liabilities ballooned to ₹274 crore in FY25 and then fell back to ₹201 crore in FY26 — the kind of swing that, in a contractor, usually tracks payables and advances moving with the project cycle.
Against ₹165 crore of borrowings the company holds ₹86 crore of cash and bank balances, leaving a net debt position near ₹79 crore. A balance sheet that funds its own growth quietly is a rare thing in this sector.
8 — Cash Flow: Sab Number Game Hai
| Year | Operating | Investing | Financing |
|---|---|---|---|
| FY24 | 65 | −4 | −79 |
| FY25 | 124 | −73 | −28 |
| FY26 | 32 | −31 | −20 |
Operating cash flow swung from a strong ₹124 crore in FY25 to ₹32 crore in FY26 — a construction firm’s cash generation is a hostage to the working-capital cycle, and a good year of collections is often borrowed from the next. Financing outflow has shrunk each year as the company services and repays rather than raises. Money in from operations, a little out to build, a little out to lenders — the shape of a firm living within its means, if unevenly.
9 — Ratios: Sexy or Stressy?
| Ratio | Value |
|---|---|
| ROE | 12.1% |
| ROCE | 15.6% |
| P/E | 8.5x |
| PAT Margin | 5.5% |
| D/E | 0.69 |
The ROCE of 15.6% is the healthiest number in the set — the capital the company deploys is earning a respectable return on the projects it runs. The ROE of 12.1% is decent but flatters the equity slightly less than ROCE flatters the capital. The PAT margin of 5.5% is thin, which is the construction sector announcing itself: revenue is large, the slice kept is small. Debt-to-equity at 0.69 shows borrowings comfortably below the equity base. A single-digit P/E on double-digit returns is the multiple and the operations telling two different stories.
10 — P&L Breakdown: Show Me the Money
| Year | Revenue | Operating Profit | Other Income | PAT | EPS (₹) |
|---|---|---|---|---|---|
| FY24 | 460 | 58 | 6 | 21.7 | 0.80 |
| FY25 | 610 | 67 | 6 | 25.9 | 0.96 |
| FY26 | 502 | 66 | 8 | 27.4 | 1.02 |
Revenue traced an arc — up to ₹610 crore, back down to ₹502 crore — while operating profit sat almost still across all three years, hovering in the ₹58–67 crore band. That flatness is the point: the FY25 revenue surge was low-margin solar EPC volume that added turnover without adding much operating profit. Other Income of ₹8 crore in FY26 is roughly 30% of PAT, so a meaningful minority of the bottom line is non-operating — the operating engine did most of the work, but not all of it. EPS moved in step with PAT (both up, share count unchanged at 26.96 crore shares), so the ₹1.02 figure is a genuine profit gain, not an accounting artefact of the share base.
11 — Peer Comparison
Quarterly figures where shown; ₹ crore.
| Company | Sales (Qtr) | PAT (Qtr) | P/E |
|---|---|---|---|
| Larsen & Toubro | 82,762 | 6,133 | 33.7x |
| Rail Vikas | 6,696 | 182 | 56.5x |
| NBCC | 4,560 | 254 | 41.8x |
| IRB Infra | 1,927 | 296 | 29.5x |
| Kalpataru Proj. | 7,778 | 431 | 23.9x |
| Madhav Infra | 254 | 11.5 | 8.5x |
Madhav is the smallest company in the room by orders of magnitude and carries the lowest multiple by a wide margin — 8.5x against a peer set clustered from the low-20s into the 50s. Its ROCE of 15.6% is not an outlier in this group; several larger peers earn more, several less. A microcap contractor priced at a fraction of the sector multiple, on returns that sit mid-pack, is the size discount and the governance discount stacked on the same ticker.
12 — Miscellaneous: Shareholding & Promoters
| Holder | % |
|---|---|
| Promoters | 68.81 |
| Public | 31.17 |
| Institutions | ~0 |
Promoter holding has been rock-steady at 68.81% with zero change and zero shares pledged — the family has neither sold down nor borrowed against its stake. The register is dominated by Ashok Khurana (30.18%) and a second Ashok Khurana holding (28.09%), with Manju, Amit, Neelakshi and other Khuranas filling the remainder. Institutions are essentially absent, which is common for a company this size. CARE credits the promoter group with a track record of infusing unsecured loans and monetising non-core assets to service debt — a family that has historically topped up the tank when the group needed it.
13 — Corporate Governance: Angels or Devils?
The audited FY26 results carried an unmodified opinion from Shah & Kadam. Below that clean headline, the year logged several items.
The Company Secretary, Khushbu Prajapati, resigned effective May 12, 2026. Her resignation letter cited repeated salary deductions for leave taken around her wedding, despite prior approvals; the company’s clarification stated the leave balance was insufficient, the excess was treated as leave-without-pay, and the deductions followed policy. The board accepted the resignation on May 29, 2026.
The FY26 secretarial compliance report flagged more. On insider trading, it recorded non-compliance — the trading window was not closed when the company disclosed the MPUVNL solar letters of award, which management represented as ordinary-course business rather than unpublished price-sensitive information. On website disclosures, the Stock Exchange observed that certain mandatory Regulation 46 disclosures could not be located, which management said were largely being rectified. The report also carried forward a prior fine of ₹11,800 for a board-meeting quorum lapse in the quarter ended September 2024, since paid.
Separately, contingent liabilities stand at ₹306 crore — larger than the ₹240 crore net worth. And the prior statutory auditors had resigned in August 2023. Each of these is a fact on the record; together they explain why a section like this exists.
14 — Industry Roast & Macro Context
Construction EPC is a business built on a cruel arithmetic: the government awards work to the lowest attractive bid, then pays on its own schedule, and the contractor finances the gap. CARE describes the space as intensely competitive and fragmented, with aggressive bidding that restricts margins — which is why a ₹500 crore contractor keeps 5.5% at the bottom. The mitigating features are real too: many road orders carry inflation-indexed price-escalation clauses, and government counterparties, while slow, are creditworthy.
The solar-EPC pivot rides the PM-KUSUM tailwind — feeder solarisation, 25-year PPAs, state-backed offtake at fixed tariffs. It is durable revenue, but the tariffs (₹2.71–2.73 per unit here) are thin, which is precisely why FY25’s solar-heavy year diluted margins. The sector’s structural risk, per CARE, is geographic concentration: an order book 93% inside two states is exposed to any policy or political shift in those states. A contractor’s fortunes are only ever as diversified as its map.
15 — EduInvesting Verdict
| Strengths | Weaknesses |
|---|---|
| Margin recovered to 13%; ROCE 15.6% | Revenue fell 17.7%; thin 5.5% PAT margin |
| Zero pledge, steady 68.81% promoter holding | Contingent liabilities (₹306 Cr) exceed net worth |
| Net worth compounding, D/E at 0.69 | Working-capital-intensive, order book 93% in two states |
| Opportunities | Threats |
|---|---|
| PM-KUSUM solar pipeline, 73.15 MW PPAs signed | Governance flags: CS exit, insider-trading and website lapses |
| ₹342 Cr MPUVNL orders, NHAI NH-146 award | Competitive bidding compressing already-thin margins |
Madhav Infra’s FY26 is a company that got smaller and more profitable in the same breath, funds its own growth without diluting shareholders, and earns a peer-average return — priced by the market at half the peer multiple. The gap between those two facts is the whole entry. A balance sheet that compounds quietly, sitting beside a governance file that doesn’t.