1. At a Glance
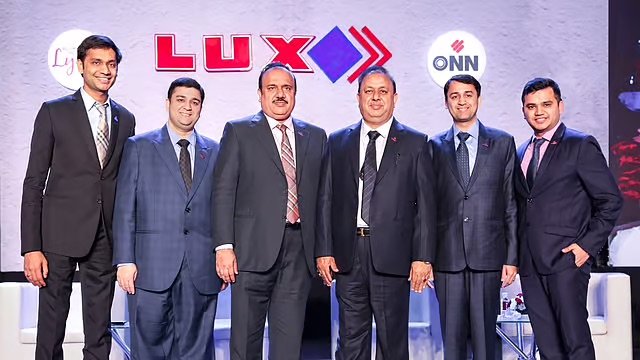
Lux Industries is India’s biggest mid-segment hosiery player with a 15% share of the organised market — but lately, its stock has been shrinking faster than a cheap vest in hot water. The business sells innerwear, outerwear, and thermals under multiple brands (with “LUX” as the flagship). Despite steady revenues, profitability has sagged, ROE has slipped to ~10%, and the stock is down ~45% in a year.
2. Introduction
Lux Industries is the kind of brand every Indian has seen — on billboards, in cricket sponsorships, and in your dad’s cupboard. The company has been around since 1995, dominating the mid-segment hosiery game. It sells everything from premium vests to leggings, from thermal wear to track pants, and targets everyone — men, women, and kids.
But the innerwear wars are brutal. Between Page Industries’ Jockey dominance, Rupa’s pricing wars, and fast-fashion nibbling at casualwear, Lux is stuck in a tricky middle: premium enough to need marketing spend, but not premium enough to demand crazy margins. Add margin compression since FY22 and a working capital cycle that’s longer than some Netflix series, and we’ve got a business fighting to keep its fit.
3. Business Model (WTF Do They Even Do?)
- Men’s Innerwear & Outerwear– Vests, briefs, trunks, track pants, jackets.
- Women’s Innerwear & Outerwear– Bras, panties, leggings, shapewear, palazzos.
- Kidswear– Basics, casuals.
- Thermal Wear– Winter segment stronghold.
Lux positions itself in themid-premiumsegment, balancing volume play with brand-building. Distribution is king: 900+ distributors, 2 lakh+ retail touchpoints, plus e-commerce.Roast note: They have more SKUs than some FMCG giants, but profitability moves like it’s wearing ankle weights.
4. Financials Overview
Let’s recalc the P/E: Latest EPS
(Jun 2025) ₹7.84 × 4 = ₹31.36 annualised. At ₹1,289 CMP → P/E ~41.1. Screener’s 25.2x is TTM-based — quarterly weakness explains the higher run-rate multiple.
- Revenue (TTM): ₹2,652 Cr
- EBITDA (TTM): ₹226 Cr (~9% margin)
- PAT (TTM): ₹154 Cr (~5.8% margin)
- ROCE: 12.7%
- ROE: 9.98%
- YoY Sales Growth (TTM): 14%Commentary: Margins are still far below FY21’s 20%+ highs. This is a volume-stable but margin-crunched story.
5. Valuation (Fair Value RANGE only)
| Method | Metric Used | Result (₹) |
|---|---|---|
| P/E Multiple | 22x FY26E EPS ₹35 | 770 |
| EV/EBITDA | EV ₹3,877 Cr + Debt, 10x EBITDA ₹226 Cr | 950 |
| DCF | 7% CAGR, 13% discount rate | 900 |
Fair Value Range:₹770 – ₹950
This FV range is for educational purposes only and is not investment advice.
6. What’s Cooking – News, Triggers, Drama
- Q1 FY26 Results: Sales ₹604 Cr, PAT ₹23 Cr — down ~30% QoQ in profit.
- Board Moves: Reappointment of 4 executive & 2 independent directors for 5 years — continuity, but also same old crew.
- Inventory


