Search for Stocks /

Lumax Auto Tech FY26: ₹4,870 Cr & A 65% Profit Surge Into A Crowded Multiple

Spotted a factual error — a wrong number, date, or fact? Tell us and we will check the source.

General information and entertainment, not investment advice. The author is not a SEBI-registered adviser or research analyst. No recommendation, no promised returns. Markets carry risk including loss of capital. Figures may not be current. Consult a registered adviser before acting.


1 — At a Glance

FY26 delivered a paradox: record revenue at ₹4,870 Cr (+34% YoY) and record net profit at ₹337 Cr (+47% YoY), yet the company sits at 37.8x earnings while the peer median pays 26.8x.

The margin held steady at 14.5% EBITDA and 6.9% PAT—solid, not stellar. That said, profit growth outpaced revenue growth by 13 percentage points. A clue: M&M and Bajaj still make up 40% of revenue. Concentration risks exist. Meanwhile, the order book at ₹1,450 Cr signals 3+ years of visible work.

Mechatronics revenue jumped 146% YoY to ₹281 Cr. Greenfuel, acquired in FY26, contributed ₹383 Cr—a new leg, not a mature one.

The tension: fast growth in emerging units meets a shrinking multiple ceiling. Watch the next 18 months.


2 — Introduction

Lumax Auto Technologies, part of the DK Jain Group since 1945, has spent 25 years in the public markets. For two decades, it concentrated on automotive lamps, gear shifters, and sheet metal. The last 3–4 years redefined it.

In March 2023, Lumax acquired 75% of IAC India for ₹587 Cr—a 4W interior systems supplier. The move cut the 2W/3W revenue share from 43% in FY22 to 24% by end of FY26, a deliberate shift toward higher-margin passenger vehicle content.

By October 2025, Lumax acquired Greenfuel Energy Solutions (60% stake) to enter CNG and hydrogen systems. Simultaneously, board approvals in May 2026 called for buying the remaining 15.97% of Lumax FAE (oxygen sensors, now 84% owned) and selling the entire 50% stake in Lumax JOPP to the German partner (margin-dilutive, small revenue). These moves frame a portfolio realignment: scale what works, exit what doesn’t.

The SHIFT tech center in Bengaluru (R&D hub for telematics, ADAS, software-defined vehicles) opened in FY26 with ~20 engineers and annual spend of ₹5–7 Cr. The company filed revenue growth guidance of 20% CAGR through FY31 and a target EBITDA margin of 20%.


3 — Business Model: WTF Do They Even Do?

Lumax supplies plastics, metal, electronics, and alternative fuels to OEMs. The portfolio:

Advanced Plastics (53% of FY26 revenue, ₹2,566 Cr): cockpits, headliners, door panels, intake systems, fuel tanks. Think interior surfaces and air management for 4W and 2W. Content per 4W vehicle expanded to ₹75K (from ₹15K five years ago), a 5x leap. Lumax Cornaglia (50% JV with Italy) manufactures air intake systems and urea tanks for VW and Tata.

Structures & Control Systems (17%, ₹816 Cr): gear shifters (60–65% market share in India for AMT), seating structures, shift towers, control housings. Lumax Mannoh (55% subsidiary with Japan) exports automatic shifters. Orders here are ₹170 Cr.

Mechatronics (emerging, ₹281 Cr, +146% YoY): power window switches, telematics control units, antennas, oxygen sensors. Lumax FAE (84% owned) makes oxygen sensors. Lumax Ituran (50% JV with Israel) makes telematics; margin diluted post-acquisition but expected to improve 150 bps in FY27.

Aftermarket (11% of sales, ₹538 Cr, +15% YoY): lamps, accessories, audio, navigation. Over 575 channel partners and 27,500 retail touchpoints. This segment is leverage for OEM downturns.

Alternate Fuels (new, ₹383 Cr via Greenfuel, 60% owned): CNG delivery systems, hydrogen prep. Orders at ₹180 Cr. Positioned as the “alternative mobility” hedge.

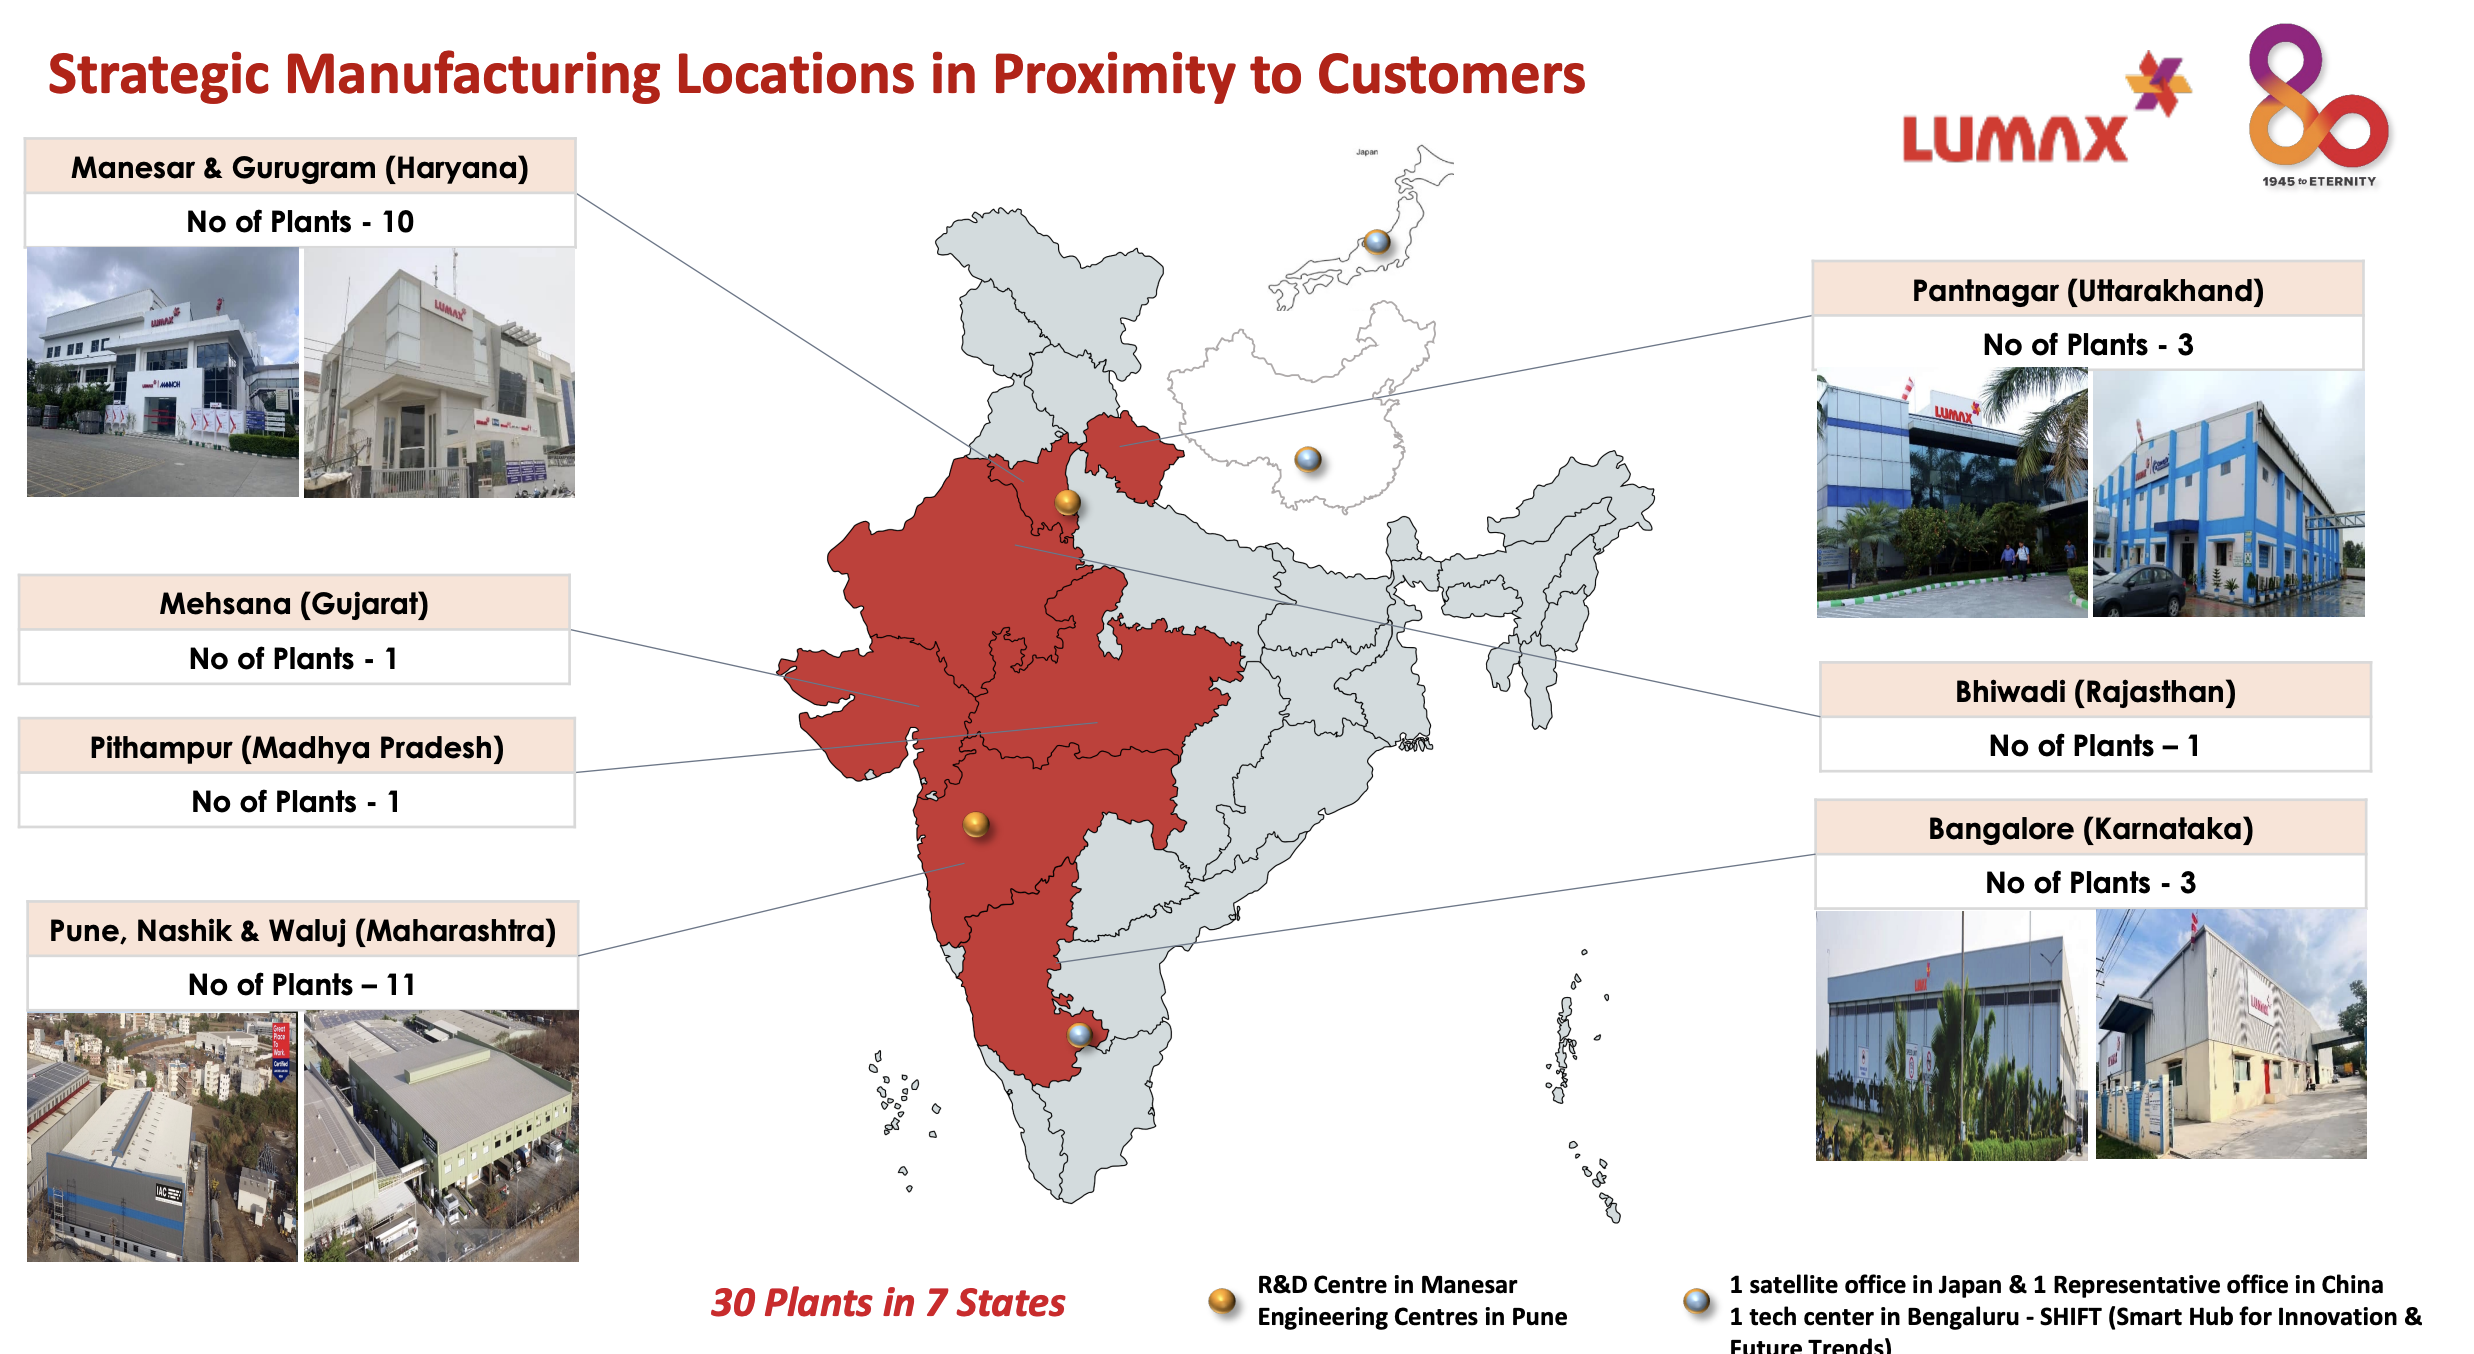
The model works via 30 manufacturing plants across 7 states, JV partnerships with Japan, Germany, Italy, Spain, Israel to localize or co-develop products, and deep OEM relationships (M&M, Bajaj, Maruti, Honda, Tata account for ~60% of revenue). No single geography dominates; all automotive is domestic. Exports are negligible.

Moat: not price (OEMs reset contracts annually), but technical capability, scale, delivery track record, and now—the shift toward electronics, software, and cleaner mobility. A 4W interior kit that talks to the car’s brain is harder to displace than a plastic trim.


4 — Financials Overview

Figures are consolidated, in ₹ crore.

MetricQ4 FY26YoYQoQFY26FY25YoY
Revenue1,417+25%+12%4,8703,637+34%
EBITDA208+26%+9%705516+37%
EBITDA Margin14.7%+10 bps-30 bps14.5%14.2%+30 bps
PAT (pre-MI)98+22%-10%337229+47%
PAT Margin6.9%-10 bps+50 bps6.9%6.3%+60 bps
EPS12.93+50%+6.6%40.9126.08+57%

Latest Quarter (Q4 FY26): Revenue ₹1,417 Cr (third consecutive record quarter). Operating profit ₹203 Cr, a 14.7% margin. Net profit ₹98 Cr pre-minority interest. Three accounting headwinds: (1) depreciation spiked due to reclassification of Greenfuel intangible asset lives (major impact), (2) tax showed a one-time deferred reversal in Q3 (now normalized to ~26%), (3) minority interest at 10% in Q4 (distorted by the intangible reclassification); full-year FY26 minority interest at 17%, guidance 15–17% going forward. Strip the noise: operating trajectory is clean.

Full Year FY26: Record revenue at ₹4,870 Cr (34% growth). EBITDA ₹705 Cr (14.5% margin, holding steady despite a 53% jump in one-time exceptional items for Labour Code notification). Net profit ₹337 Cr, highest ever. EPS ₹40.91 (full year, not annualized).

Concall Signal: Management attributed outperformance to “robust execution, sustained customer momentum, and disciplined operational focus,” plus faster-than-industry growth from scale-up in core segments and strong aftermarket traction.

5 — Market Expectations & Historical Multiples

This section describes how the market is currently pricing the company and how that compares with its own history and peer group. It is descriptive, not predictive.

MetricCurrent5-Year AvgPeer Median
P/E37.8x24.8x26.8x
EV/EBITDA17.0x
P/B8.95x3.29x
ROE26.8%19.9%13.5%
ROCE21.4%15.88%

The market currently pays 37.8x earnings here versus a 5-year historical average of 24.8x and a peer median of 26.8x. The price sits above both benchmarks. EV/EBITDA at 17.0x exceeds the peer median ROCE-adjusted fair range of 12–15x for cyclical auto suppliers.

What is the market pricing in? High profit growth (57% EPS CAGR in the last year), a shift from 2W to higher-margin 4W and electronics, a young order book with execution visibility, and 20%+ CAGR ambitions to FY31. The multiple also reflects confidence in management’s ability to scale without margin collapse—ROE at 26.8% (vs. peer median 13.5%) and ROCE at 21.4% (vs. 15.88%) suggest capital is working. Sentiment favors the story of a Tier-1 supplier turning “Tier 0.5 system integrator.”

The tension: growth-rate premium vs. cyclical sector base case. If FY27 growth moderates to mid-30s and margin pressures emerge (commodity inflation acknowledged by management), the multiple may contract back toward peer medians—a 30–35% repricing risk on price alone.

One closing factual observation: the stock has outperformed the underlying automotive sector by 8–10 percentage points per annum over the past 3–5 years, a run that markets rarely extend without inflection in the underlying metrics.


6 — What’s Cooking

IAC India Merger Completed (October 2025). 100% ownership of the interior systems division now consolidated, eliminating minority friction. FY26 contribution: ₹1,594 Cr revenue, ₹281 Cr EBITDA, ₹127 Cr PAT. Order book ₹500 Cr.

Greenfuel Integration Underway. 60% stake acquired; merger into SPV completed. FY26 contribution ₹383 Cr revenue, ₹76 Cr EBITDA, ₹60 Cr PAT. Order book ₹180 Cr. Management expects it “accretive to group average over medium term” despite current margin compression (integration costs).

Lumax FAE Acquisition Planned. Board approved acquisition of remaining 15.97% stake (currently 84% owned, 16% with Spain’s FAE). Once complete, wholly owned oxygen sensor platform for 2W/3W. Rationale: simplify ownership, capture full upside.

Lumax JOPP Stake Sale Approved. Board approved sale of entire 50% stake in Lumax JOPP Allied Technologies (transmission products) to German partner Jopp Holding for ₹1.52 lakh by June 2026. Rationale: “small revenue contributor with negative impact on bottom line”; management wants “laser-sharp focus” on scalable, margin-expanding businesses. A clean portfolio trim.

Order Book: ₹1,450 Cr (vs. ₹1,300 Cr H1 FY25). Execution phased: 25% in FY27 (₹366 Cr), 54% in FY28 (₹784 Cr), 21% in FY29 (₹300 Cr). By product: Advanced Plastics ₹542 Cr (38%), Structures & Control Systems ₹330 Cr (23%), Mechatronics ₹398 Cr (28%), Alternate Fuels ₹180 Cr (12%). Management flagged that “a majority is new business,” not just replacement; overlap with organic segment growth cited as modest.

Capex Guidance FY27: ₹275–300 Cr. FY26 spent ₹233 Cr (incl. ₹45 Cr land acquisition in Gujarat/Kharkhoda). Focus: capacity expansion for IAC, Alps Alpine, Mechatronics.

CRISIL Rating Upgrade. May 2026: upgraded from AA- to AA (long-term), Stable outlook. Debt facility capacity enhanced from ₹332 Cr to ₹681 Cr. Rationale: sustained revenue growth, profitability, and healthy cash generation.


7 — Balance Sheet

ItemMar 2024Mar 2025Mar 2026
Total Assets2,5893,2353,947
Equity Capital141414
Reserves7769211,197
Borrowings8109021,231
Other Liabilities9901,3981,506
Total Liabilities2,5893,2353,947

Asset Snapshot: Fixed assets (incl. ROU) ₹1,516 Cr (up from ₹1,013 Cr in FY24), CWIP ₹65 Cr, goodwill & intangibles ₹474 Cr (Greenfuel acquisition), investments ₹565 Cr. Current assets ₹1,977 Cr: inventory ₹412 Cr, receivables ₹1,015 Cr, cash ₹94 Cr.

Liability Snapshot: Equity (capital + reserves) ₹1,210 Cr. Borrowings ₹1,001 Cr (LT ₹376 Cr, ST ₹625 Cr, leases ₹230 Cr). Minority interest ₹266 Cr (IAC and Greenfuel stakes). Total liabilities ₹3,947 Cr = Total assets. ✓

Three Observations:

  1. Debt jumped ₹329 Cr in FY26 (from ₹902 Cr), a 36% increase. Greenfuel and IAC acquisitions financed via debt; management guided for repayment to start FY27 and stabilize below ₹1,000 Cr over 3–4 years.
  2. Receivables at ₹1,015 Cr (76 days of sales) are sticky. OEM payment terms at 45–60 days; the overshoot reflects Greenfuel’s longer receivables cycle and higher working capital intensity of the interior systems business.
  3. Minority interest jumped to ₹266 Cr (from ₹359 Cr) post-merger accounting—not a cash outflow, but a footnote to watch as cash distribution policy evolves.

One Wisdom Line: A balance sheet with nothing hidden, but debt appetite revealed. Growth via acquisition has a carry cost; whether it compounds returns depends on execution velocity.


8 — Cash Flow: Sab Number Game Hai

YearOperatingInvestingFinancing
FY24265-249-40
FY25290-216-53
FY26460-280-170

Operating Cash (FY26): ₹460 Cr, highest ever. Up from ₹290 Cr in FY25. PAT of ₹337 Cr + non-cash depreciation of ₹179 Cr + working capital movements produced ₹460 Cr. The cash conversion ratio (operating cash / net profit) at 83% is healthy—most profit is real money.

Investing Cash: ₹280 Cr outflow. Capex ₹233 Cr (capacity, acquisitions), asset purchases ₹47 Cr. Free cash flow = operating cash minus capex = ₹227 Cr, a healthy 5% of revenue.

Financing: ₹170 Cr outflow. Debt raised offset by dividend (₹37 Cr at ₹5.50 per share) and lease payments. Net debt to EBITDA expected to stabilize at 1.2–1.3x from current 1.35x after repayment ramp.

One Wisdom Line: Operating cash is real and growing, but capex discipline will be the make-or-break lever. Overinvest in unproven segments, and free cash dries up fast.


9 — Ratios: Sexy or Stressy?

RatioValueContext
ROE26.8%Equity is working hard—26.8% return on the ₹1,210 Cr net worth. Peer median 13.5%, so nearly 2x.
ROCE21.4%Invested capital (debt + equity minus cash) generates 21.4% returns. Peer median 15.88%, so 35% above peers.
P/E37.8xMarket pays 37.8x to own each rupee of FY26 earnings. 5-year average 24.8x; investor is paying a premium.
PAT Margin6.9%Bottom line converts 6.9 paise per rupee of sales. Thin, typical for auto suppliers.
D/E0.46x (LT) / 1.02x (Total)Debt-to-equity at 1.02x (including ST and leases). Conservative vs. peers.

ROE at 26.8%: The equity is punching above weight. A ₹1,210 Cr base produced ₹337 Cr net profit in one year. The metric reflects a young, scaling platform with high capex falling into stable operations. Contrast to an older supplier where capex is maintenance.

ROCE at 21.4%: The firm deploys capital into organic plant and equipment and now acquisitions. 21.4% return on that capital exceeds cost of debt (6–7%) and equity (10–12%) implied by its cost of capital. The spread sustains the growth premium.

P/E at 37.8x: The historical 24.8x suggests the market has revalued the business upward. If growth decelerates to 25–30% or margins compress 200 bps, the multiple could slide to 28–32x—a 12–25% price adjustment.


10 — P&L Breakdown: Show Me the Money

YearRevenueEBITDAPAT
FY242,822369167
FY253,637516229
FY264,870705337

Revenue Trajectory: FY24 to FY26, revenue grew from ₹2,822 Cr to ₹4,870 Cr, a 72% CAGR (or 33–34% YoY). Raw material and employee costs rose in tandem, but operating profit (EBITDA) grew faster, signaling margin expansion from scale and product mix.

EBITDA: Jumped from ₹516 Cr (14.2% margin) in FY25 to ₹705 Cr (14.5% margin) in FY26. The 30 bps margin improvement came from leverage: revenue grew 34% but EBITDA grew 37%, implying fixed-cost absorption and operational gearing.

Net Profit: Exploded from ₹229 Cr to ₹337 Cr (+47%) despite higher depreciation (intangible asset write-downs) and interest (debt from acquisitions). This outperformance—profit +47% vs. revenue +34%—is the stock’s ballast. Subtract the exceptional items (₹14.5 Cr labour code charge), and normalized profit is still ~₹324 Cr, a 41% YoY growth.

Momentum Summary: The business is reaccelerating. A shift from 2W (low margin, high volume) to 4W and electronics (higher margin, scaling volume) is in motion. If FY27 revenue crosses ₹5,800–6,000 Cr and margin holds at 14–14.5%, the narrative stays intact. If FY27 flattens to mid-20s growth and margin slips to 13%, the multiple compression will be swift.


11 — Peer Comparison

CompanyRevenuePATP/E
Samvardhana Motherson126,1044,13335.7x
Bosch India20,0352,35047.1x
Bharat Forge16,8121,18078.9x
Schaeffler India9,7921,25149.1x
Uno Minda19,6581,21750.2x
Tube Investments22,84765989.4x
Sona BLW Precision4,12468553.4x
Lumax Auto Tech4,87028737.8x
Peer Median9214726.8x

Lumax sits at ₹4,870 Cr revenue, 5th largest by sales in the cohort, but mid-pack on P/E at 37.8x vs. peer median 26.8x. Its ROE of 26.8% and ROCE of 21.4% are the cohort’s strongest—metrics that justify a modest premium but not a 41% premium over the median multiple.

Samvardhana Motherson (35.7x) is larger but trades at a lower multiple despite lower ROE; Bosch (47.1x) is premium-priced for quality and stability. Bharat Forge and Tube Investments trade at sky-high P/E ratios due to cyclicality and low earnings bases. Lumax, in contrast, has clarity: growing order book, visible execution, and margin expansion. Yet the multiple-vs.-margin dynamic suggests the market has already priced in FY27–28 earnings momentum.


12 — Shareholding & Promoters

Holder%
Promoters56.0%
Deepak Jain19.0%
Anmol Jain18.9%
Lumax Finance Private Limited17.8%
DIIs16.8%
FIIs8.4%
Public18.8%

Promoter Lock: Jain family (Deepak, Anmol, and the family office Lumax Finance) control 56%, unchanged for years. No pledges. Stable, founder-led governance. Dhanesh Kumar Jain (Chairman) is 80+; succession to Anmol (MD, brother of Deepak) is the low-key story.

Institutional Flows: DIIs have grown from 6.85% (Jun 2023) to 16.8% (Mar 2026), a strong vote of confidence. FIIs declined from 18.2% (Jun 2023) to 8.4%, suggesting early momentum investors are taking profits or sector rotation.

Promoter Roast: The Jains have built a genuine business—not just a trading shop. Lumax has acquired, integrated, and scaled successfully. That said, debt-funded acquisitions in an inflationary environment are a test. If integration stumbles (Greenfuel margin profile not meeting expectations, IAC cannibalization, mechatro-nics scaling delays), the promoters’ reputation is on the line. No obvious governance red flags, but watch for related-party transaction growth.


13 — Corporate Governance: Angels or Devils?

Auditors: EY (Lumax India), signed off FY26 results with no qualifications.

Board: Chairman Dhanesh Kumar Jain (80+, founder legacy), Vice Chairman Deepak Jain, MD Anmol Jain, + 4 independent directors (Parag Chandulal Shah, Arun Kumar Malhotra, A P Gandhi, Diviya Chanana). Gender diversity below 20%; CSR roadmap targets 20% by FY30.

Pledges: Zero pledges in FY26—a clean signal from promoters.

Related Party: Material related-party transactions with Lumax Industries (the parent holding company) for shared services, rent, purchases. Amounts disclosed transparently; no red flags on arm’s-length pricing. Board approval in place.

Resignations: None flagged in FY26 concall or announcements.

Tax Demands: No material tax demand or litigation disclosed in investor presentation or credit rating note. One caveat: Greenfuel acquisition may carry legacy tax exposure (standard due diligence risk).

Credit Rating: CRISIL upgraded to AA (Stable) in May 2026 from AA- (Positive); commercial paper at A1+. Interpretation: low financial risk, strong operational profile, access to capital markets.

Governance Red Flags as Facts: Related-party transaction volume is material (parent company leases, services); Dhanesh Kumar Jain is aging (succession plan opaque); debt-funded acquisitions mean management’s skin is in the game for integration success.


14 — Industry Roast & Macro Context

Indian automotive supply has three dynamics worth roasting:

Pricing Wars: OEMs own the contract renewal cycle. Annual 2–5% cost-down demands are the baseline; suppliers absorb inflation or lose margin. Lumax management acknowledged this: “back-to-back understanding with OEMs with 3–6 month lag for recoveries.” Translation: you eat the cost for Q, then bill it forward. If inflation accelerates (crude, metals, labour), the catch-up fails.

Demand Cyclicality: The sector is chained to passenger vehicle production. When PV slows (recession, rate hikes, consumer retrenchment), auto supply becomes a margin-compression grinder. FY26 rode a 27% PV growth (per SIAM); if FY27 moderates to mid-single digits, Lumax’s growth story collapses into the sector norm.

Alternative Mobility (EV/CNG) Cannibalization: Lumax is hedging with Greenfuel (CNG/hydrogen) and EV-agnostic product positioning. Yet the shift from ICE to EV is structural. Content per ICE vehicle will decline (fewer gears, simpler mechanics); content per EV rises (electronics, battery management, thermal). The bet: early-mover advantage in EVs offsets ICE tailwinds. This is a real hinge in 5–7 years.

Export Opportunity (Untapped): Aftermarket exports are minimal. Lumax has a China office (8 people, targeting 15) to hunt partnerships. International 4W OEM wins would derisks the domestic concentration. Nothing concrete yet.

Regulation (Tailwind): BS-VI norms have normalized. ADAS and connected-vehicle regs are coming (global trend). Safety and emissions demand higher-value content—a Lumax strength.

The sector is competitive, cyclical, and consolidating globally. Lumax’s move toward systems integration and electronics is the right narrative, but narrative alone doesn’t compound returns in down cycles.


15 — EduInvesting Verdict

StrengthWeakness
26.8% ROE, 21.4% ROCE—capital efficiency is real.Concentration: M&M + Bajaj = 40% of revenue. OEM churn risk.
Order book ₹1,450 Cr, 3-year visibility, majority new business.P/E of 37.8x above peer median and own history; multiple compression risk.
Gross margin expanding: 4W interior content per vehicle 5x in 5 years.Debt at ₹1,231 Cr; integration risk on Greenfuel (slow margin ramp).
M&A discipline improving: exiting JOPP, acquiring FAE fully, simplifying.Cyclical sector; FY27 demand could moderate if rural/urban slowdown hits.
Management capability credible; CRISIL AA rating, no pledges, clean audit.Related-party transactions material; governance dependency on Deepak/Anmol.

The Central Tension: A company with genuine operational momentum, high capital returns, and 3-year order visibility is priced at 40% above its long-term multiple, at a valuation that assumes sustained 30%+ growth and 15%+ EBITDA margins. If the company delivers (FY27 revenue >₹5,800 Cr, margin 14.5%), the narrative holds and the stock re-rates upward. If FY27 growth slips to mid-20s or margins compress to 13%, the multiple halves and price follows.

The next 18 months will clarify whether Lumax is a genuine systems integrator compounding capital, or a cyclical supplier riding a demand wave. One thesis, one outcome. No in-between.
