1. At a Glance
A 436% PAT jump and a 53% sales boost? Either Lords Chloro Alkali is cooking some serious caustic soda… or they’ve finally found the pH balance of profitability. Welcome to India’s smallcap chlorine crusader with a big FY26 flex.
2. Introduction with Hook
If the chemicals market were a WWE ring, Lords Chloro Alkali was the underdog wrestler thrown into the ropes in FY23. But Q1 FY26? That’s the chair shot comeback.
- PAT YoY growth: 436% (Rs. 10.45 Cr)
- Sales YoY growth: 53% (Rs. 100.20 Cr)
While bigger peers like Tata Chemicals are still busy figuring out if they’re a fertilizer or a salt brand, Lords quietly slapped a solar panel on their roof and said, “Hold my chlorine.”
3. Business Model (WTF Do They Even Do?)
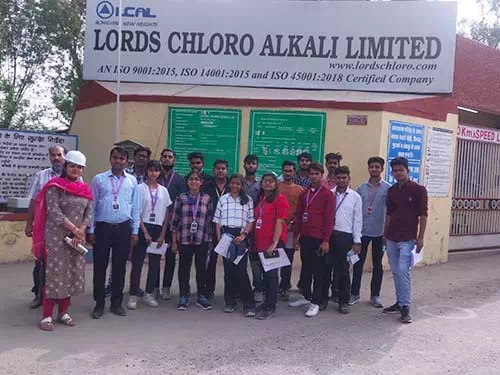
Lords Chloro Alkali Ltd is in the caustic soda game, and trust us—it’s not as boring as it sounds. Their products (caustic soda lye, hydrochloric acid, liquid chlorine, etc.) are critical input chemicals used in:
- Textile processing
- Paper & pulp manufacturing
- Soap & detergent industries
- Alum production
- Water treatment and more
With ISO 9001, 14001, and 45001 certifications, the company’s pushing not just volume but credibility.
Bonus twist? They’re injecting green into this otherwise bleach-white industry via solar energy initiatives.
4. Financials Overview
Q1 FY26 vs Q1 FY25:
| Metric | Q1 FY26 | Q1 FY25 | YoY Change |
|---|---|---|---|
| Revenue | ₹100.47 Cr | ₹65.48 Cr | +53% |
| EBITDA | ₹20 Cr | ₹6 Cr | +233% |
| PAT | ₹10.45 Cr | ₹1.95 Cr | +436% |
| OPM | 20% | 9% | ↑ Double |
A year ago, they were coughing on their own chemical fumes. This year, they’re back with margin gas masks on.
5. Valuation
Let’s get nerdy.
- TTM EPS: ₹5.82
- CMP: ₹190
- P/E: ~32.5x
- Book Value: ₹72.2 → P/BV ~2.6x
Fair Value Range (Based on 3 Scenarios):
| Method | FV Range (₹) |
|---|---|
| DCF + Sustainable Margin | 150 – 185 |
| Peer Avg (Chemicals midcap) | 140 – 200 |
| P/E Re-rating Potential | 180 – 230 |
Conclusion? At CMP ₹190, it’s playing somewhere between “fully priced” and “mildly euphoric.”
6. What’s Cooking – News, Triggers, Drama
- Q1 FY26 Blockbuster: PAT +436% YoY. Don’t need a CFO to get excited.
- Capacity Expansion: Green energy. Solar + Caustic = hot & clean.
- Borrowing limit raised: From Rs 43 Cr to Rs 132 Cr. A bit of financial leverage alchemy at play?
- Power Savings: Cost benefits coming in from solar installation.
- Operating margins: From negative in FY23 to 20% in Q1 FY26.
7. Balance Sheet
| FY End (₹ Cr) | FY23 | FY24 | FY25 |
|---|---|---|---|
| Equity | 25 | 25 | 25 |
| Reserves | 144 | 139 | 157 |
| Borrowings | 22 | 43 | 132 |
| Total Assets | 238 | 262 | 376 |
| Fixed Assets | 124 | 135 | 271 |
Key Points:
- Capex bump shows in assets: doubled fixed assets in 1 year
- Leverage spike = expansion mode. But watch for interest burden in FY26
- Reserves growing, not exploding. Not debt free, but not debt drowning either.
8. Cash Flow – Sab Number Game Hai
| Year | CFO | CFI | CFF | Net Flow |
|---|---|---|---|---|
| FY23 | ₹69 Cr | ₹-15 Cr | ₹-24 Cr | ₹30 Cr |
| FY24 | ₹-14 Cr | ₹-31 Cr | ₹18 Cr | ₹-27 Cr |
| FY25 | ₹9 Cr | ₹-125 Cr | ₹94 Cr | ₹-22 Cr |
Translation:
- FY25 was a “Spend First, Pray Later” year
- Capex cash drain of ₹125 Cr funded by ₹94 Cr debt
- Net operating cash is positive but thin. All eyes on FY26 recovery
9. Ratios – Sexy or Stressy?
| Ratio | FY23 | FY24 | FY25 |
|---|---|---|---|
| ROCE (%) | 44% | -3% | 5% |
| ROE (%) | 21% | -1.91% | 4% |
| Debtor Days | 15 | 42 | 50 |
| Working Capital Days | 15 | 53 | 69 |
| OPM (%) | 28% | 0% | 9% |
Verdict:
Margins recovering, ROCE back from the dead. But debtor & WC days rising = possible receivables lag. Keep an eye.
10. P&L Breakdown – Show Me the Money
| Year | Sales | EBITDA | PAT | EPS |
|---|---|---|---|---|
| FY23 | ₹295 Cr | ₹84 Cr | ₹53 Cr | ₹21.16 |
| FY24 | ₹221 Cr | ₹1 Cr | ₹-5 Cr | ₹-1.91 |
| FY25 | ₹270 Cr | ₹24 Cr | ₹6 Cr | ₹2.46 |
| TTM | ₹305 Cr | ₹40 Cr | ₹15 Cr | ₹5.82 |
Yo-yo Profitability: FY24 was their detox phase. FY25 was gym. FY26 = possibly beast mode?
11. Peer Comparison
| Company | P/E | ROCE (%) | Sales (Cr) | PAT (Cr) | MCap (Cr) |
|---|---|---|---|---|---|
| Lords Chloro | 32.5 | 5.32 | 305 | 15 | ₹477 Cr |
| GHCL | 9.7 | 24.2 | 3183 | 601 | ₹5809 Cr |
| GNFC | 13.5 | 9.6 | 7892 | 597 | ₹8035 Cr |
| Deepak Fert | 21.9 | 16.0 | 10274 | 933 | ₹20533 Cr |
Conclusion:
Lords Chloro = minnow in a pool of whales. But P/E > everyone. So either they know something… or we’re buying expensive chlorine dreams.
12. Miscellaneous – Shareholding, Promoters
| Category | % Holding (Jun 2025) |
|---|---|
| Promoters | 74.66% |
| Public | 25.29% |
| FIIs + DIIs | ~0.04% |
| Shareholders | 46,921 |
No dilution, no drama. Promoters tightly in control. But also, no dividends since inception. They believe in silent compounding. Or they’re cheap.
13. EduInvesting Verdict™
Lords Chloro is your classic microcap phoenix. After a dismal FY24, it’s now flexing PATs, capex, solar power, and margins. But the ride ain’t over.
- What we like:
- Q1 FY26 margins.
- Capex → fixed assets jump.
- Strong promoter skin in game.
- Red Flags:
- Debt ballooning to ₹132 Cr
- Rising debtor days
- Still small in scale — not yet “chemical royalty”
Is it a multibagger? Maybe. Is it volatile? Definitely. Is it boring? Never.
Metadata
– Written by EduInvesting Team | 21 July 2025
– Tags: Lords Chloro Alkali Ltd, Q1 FY26 Results, Chemicals, Caustic Soda, Solar Powered Manufacturing, Microcap Revival


