01 — At a Glance
The Gas Giant With Bipolar Stock Charts and Chaotic Management
- 52-Week High / Low₹7,870 / ₹5,202
- Q3 FY26 Revenue₹701 Cr
- Q3 FY26 PAT₹192 Cr
- Q3 FY26 EPS₹22.46
- Annualised EPS (Q3×4)₹89.84
- Book Value₹463
- Price to Book14.6x
- Dividend Yield0.07%
- Debt / Equity0.02x
- Operating Profit Margin37%
Auditor’s Opening Observation: Linde India closed Q3 FY26 with ₹701 crore quarterly revenue (+15.7% YoY) and a shocking ₹192 crore PAT (+68% YoY). The operating profit margin expanded to a stratospheric 37%. But here’s the kicker: at ₹6,784, the stock trades at 99.2x trailing P/E. You’d think that kind of valuation comes with a 40-year growth roadmap and a ticket to Mars. Instead, it’s a gas company with ₹67 crore debt, a dividend yield of 0.07%, and management turnover that reads like a soap opera script. Stock price CAGR: 38% over 10 years. Recent performance: a roller coaster held together by quarterly earnings surprises and pure faith.
02 — Introduction
Meet Linde India: 75% BOC, 100% Confusing
Linde India Limited is 75% owned by BOC Group, UK. That name should ring bells. BOC is part of the sprawling Linde plc family (formerly Praxair merged with Linde AG). So imagine this: a British-German industrial gases conglomerate decided to run a subsidiary in India, and that subsidiary decided that its valuation should rival a software unicorn.
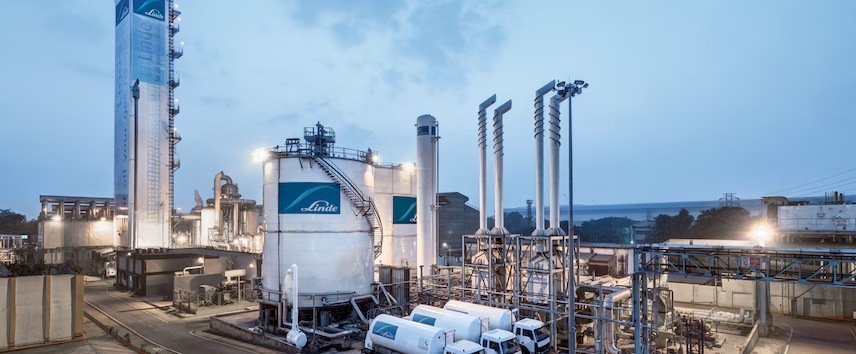
The business is straightforward. Companies need industrial gases — oxygen for steel mills, nitrogen for chemicals, helium for semiconductors, carbon dioxide for food processing. Linde has 26 operating plants, runs on-site installations, merchant bulk deliveries via cryogenic tankers, and packaged gas cylinders. They also do project engineering — designing, building, and commissioning air separation units (ASUs) for big-ticket clients like TATA, SAIL, JSW, HPCL, and ONGC. The order book hit ₹2,020 crore as of March 2025.
Business model is solid. Execution has been textbook. Financial results are impressive. But the valuation? It’s trading like the Indian version of a Silicon Valley hypergrowth company. At 99.2x P/E and 14.6x book value, Linde is pricing in a level of growth that would make Tesla jealous. Revenue is growing at 7% annually over five years. ROCE is 16.9%. Compare that to the valuation, and you’re staring at the kind of disconnect that either resolves with a 60% stock price collapse or proves the market’s prescience. We’re betting on the former.
Plus, December 2025 was a bloodbath for internal management. The MD resigned. The CFO announced departure. The company appointed an interim CFO. SEBI is investigating related-party valuations. It’s a lot.
Context Note: Over 10 years, Linde’s stock delivered a 38% CAGR — rare for an industrial gases company. Over the last 3 months alone: +15.9%. This is peak euphoria pricing meeting genuine business quality. The gap between the two is where investing stories get written.
03 — Business Model: What’s In The Gas?
Two Legs. One Stable. One On Fire. Both Overpriced.
Linde India operates two distinct businesses split almost 65-35.
Gases & Services (65% of FY25 revenue): They manufacture and distribute industrial and medical gases through 26 operating plants across India. On-site business supplies pipeline gases directly to large mills (TATA Steel, JSW, SAIL). Merchant bulk delivers liquefied gases via specialized tanker trucks — think of it as the UPS of cryogenic logistics. Packaged gases sell compressed cylinders for small-scale industrial users. Collectively, they serve over 1,000 industrial customers, hospitals needing medical oxygen, and specialty sectors like semiconductors. The margin profile is decent (think 35-45% OPM), but it’s capital-intensive and grows slowly because it’s mature.
Project Engineering Division (35% of FY25 revenue): This is where magic happens and valuation ratios combust. They design, engineer, build, and commission air separation units (ASUs), nitrogen plants, PSA systems, and gas distribution networks for Fortune 500 industrials. Turnkey projects for DRDO, BARC (nuclear), IPR (fusion research), TATA Steel, and oil majors. The order book swelled to ₹2,020 crore. Q3 saw ₹704 crore in new order intake. Project margins vary wildly (30-50%), but the lumpiness of large contracts gets smoothed via quarterly revenue recognition. This division is why quarterly results feel bi-polar.
The math looks good on paper. Gases are a recession-resistant, must-have input for industrial production. Steel production, oil & gas extraction, chemical synthesis — all require gases 24/7. In a bull market, capex-heavy industrial clients approve big ASU projects. In a bear market, gases still sell, just slower. So Linde has a portfolio hedge. Yet at current valuations, even that hedge doesn’t justify 99x P/E.
On-Site Gas Supply~45%Core Business
Merchant Bulk~15%Tanker Logistics
Packaged Gases~5%Cylinder Sales
Project Engineering~35%ASU Contracts
Capital Intensity Reality Check: Linde’s CWIP (Capital Work in Progress) was ₹1,266 Cr as of Sept 2025. That’s massive. ASU plants cost hundreds of crores each. New facilities in Unnao (Lucknow), plus expansion plans at Odisha (Tata Steel), Gujarat (Asian Paints) — all require upfront capex. Operating CF is ₹584 Cr, but investing CF burns ₹1,305 Cr. Hence net cash flow is negative. This is a capital-hungry business pretending to be a cash machine.
💬 If industrial gases are the “boring moat,” why does Linde feel like a venture-backed growth stock? Drop your theory!
04 — Financials Overview
Q3 FY26: The Surprise Factory
Result type: Quarterly Results | Q3 FY26 EPS: ₹22.46 | Annualised EPS (Q3×4): ₹89.84 | FY25 Full-Year EPS: ₹52.51
| Metric (₹ Cr) |
Q3 FY26 Dec 2025 |
Q3 FY25 Dec 2024 |
Q2 FY26 Sep 2025 |
YoY % |
QoQ % |
| Revenue | 701 | 606 | 644 | +15.7% | +8.8% |
| Operating Profit | 257 | 192 | 282 | +34.1% | -8.9% |
| OPM % | 37% | 32% | 44% | +500 bps | -700 bps |
| PAT | 192 | 114 | 169 | +68.1% | +13.6% |
| EPS (₹) | 22.46 | 13.37 | 19.82 | +68.0% | +13.4% |
Profit Explosion Explained: Q3 FY26 PAT jumped 68% YoY. Revenue grew 15.7%. The gap? Mix shift. Project engineering margins expanded, and some big contracts completed with fat margins. OPM at 37% is stellar — better than Q3 FY25’s 32%, though lower than Q2’s 44% (which was a freak high). The true run-rate OPM is probably 32-37%. EPS at ₹22.46 is real. Annualised at ₹89.84, it gives a trailing P/E of 75.4x — still absurd. But “only” 75x instead of 99x. The full-year FY25 EPS was ₹52.51. If Q3’s performance repeats, FY26 could deliver ₹70-75 EPS. At that level, P/E drops to a “mere” 90x. Stunning.
05 — Valuation Discussion: Fair Value Range
What’s This Really Worth? Let’s Try Three Approaches.
Join 10,000+ investors who read this every week.