At a Glance
Laxmi Organic’s Q1 FY26 results are in, and investors might need an extra shot of ethanol (the drinkable kind) to digest them. Net profit slipped to ₹21 crore, down a not-so-fabulous 37% YoY, while revenue flatlined around ₹693 crore. Operating margins? A wheezy 4%, because apparently cost control is a mythical creature here. Stock’s at ₹205, a far cry from its ₹326 high. Promoters shaved off stake, ROE is crawling, and the market cap of ₹5,673 crore is starting to feel like an expensive joke.
Introduction
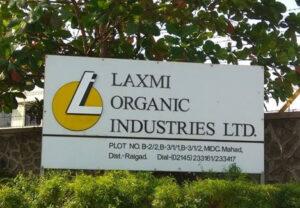
Ah, Laxmi Organic – the chemical cocktail of hopes and heartbreaks. Born in 1989, the company plays in specialty chemicals, but FY26 is testing whether “specialty” refers to its products or the unique way it torches shareholder wealth.
The quarter was a perfect blend of flat revenues, compressed margins, and a profit number that looks like it accidentally wandered in from a smaller company’s P&L. Promoters have been quietly reducing their stake (currently 69.38%), probably to buy tissues for crying investors. FIIs flirted with the stock but bailed faster than a Netflix show’s second season.
Business Model (WTF Do They Even Do?)
Laxmi Organic operates through two main segments:
- Essentials Segment – Ethyl Acetate, Acetic Anhydride, solvents, ethanol, etc. These feed pharma, packaging, and industrial sectors.
- Specialty (Diketene Derivatives) – Acquired from Clariant, these high-margin products theoretically should save the day, but Q1 margins say otherwise.
The company exports to 30+ countries, yet its numbers scream “domestic blues.” The model is simple: make chemicals, sell chemicals, repeat. Execution? Let’s just say it’s a periodic table of missed opportunities.
Financials Overview
Q1 FY26 Highlights:
- Revenue: ₹693 crore (↓3.5% YoY)
- Operating Profit: ₹31 crore (OPM 4%, down from 8%)
- PAT: ₹21 crore (↓37.7% YoY)
- EPS: ₹0.77
Over the years, sales have grown at a lukewarm 4% TTM, while profit growth shrank 14%. Return ratios (ROE 5.9%, ROCE 8.5%) are closer to savings account returns than industry peers.
Commentary? Imagine buying a Ferrari but it runs like an autorickshaw.
Valuation
Current P/E of 56x screams “overvalued,” unless the company suddenly discovers a magic formula.
Fair Value Calculations:
- P/E Method:
- Industry P/E ~40x, EPS ₹3.6 → Fair Price = ₹144
- EV/EBITDA Method:
- EV/EBITDA ~12x, EBITDA ₹239 Cr → EV = ₹2,868 Cr → Fair Price ≈ ₹145
- DCF (optimistic):
- Assuming 10% CAGR, WACC 9%, terminal growth 3% → Fair Price ≈ ₹150
💡 Fair Value Range: ₹140 – ₹155 (Current price ₹205 = premium dreams)
What’s Cooking – News, Triggers, Drama
- QIP funds ₹259 crore fully utilized (at least someone’s spending).
- No deviation in IPO proceeds – the auditor probably had to pinch himself.
- Capex ongoing, but margins say “meh.”
- Demand slowdown in packaging & pharma solvents hitting top line.
- Global raw material volatility continues to slap earnings.
Balance Sheet
| (₹ Cr) | Mar 2025 |
|---|---|
| Assets | 3,045 |
| Liabilities | 880 |
| Net Worth | 1,906 |
| Borrowings | 258 |
Auditor’s Joke: Assets are bulking up, but returns on them? Let’s just say even fixed deposits flex harder.
Cash Flow – Sab Number Game Hai
| (₹ Cr) | 2023 | 2024 | 2025 |
|---|---|---|---|
| Ops | 199 | 561 | 108 |
| Investing | -384 | -490 | -268 |
| Financing | 232 | -42 | 90 |
Stand-up Take: Cash from ops fell like a Bollywood sequel’s ratings. Investing cash flow is perpetually negative – because capex never sleeps.
Ratios – Sexy or Stressy?
| Ratio | Value |
|---|---|
| ROE | 5.9% |
| ROCE | 8.5% |
| P/E | 56.4 |
| PAT Margin | 8% |
| D/E | 0.14 |
Verdict: These ratios aren’t sexy. They’re the kind you hide from Tinder.
P&L Breakdown – Show Me the Money
| (₹ Cr) | 2023 | 2024 | 2025 |
|---|---|---|---|
| Revenue | 2,791 | 2,865 | 2,985 |
| EBITDA | 243 | 256 | 286 |
| PAT | 125 | 121 | 114 |
Auditor Roast: Sales creep up like Monday mornings, profits dive like Friday night plans.
Peer Comparison
| Company | Revenue (₹ Cr) | PAT (₹ Cr) | P/E |
|---|---|---|---|
| Pidilite | 13,140 | 2,093 | 70 |
| Navin Fluorine | 2,349 | 289 | 90 |
| Deepak Nitrite | 8,281 | 680 | 37 |
| Laxmi Organic | 2,960 | 101 | 56 |
Commentary: Peers are flexing muscles; Laxmi is flexing excuses.
Miscellaneous – Shareholding, Promoters
- Promoters: 69.38% (down from 72.5% – ouch)
- FIIs: 1.63% (they came, they saw, they ran)
- DIIs: 4.05% (still hopeful?)
- Public: 24.93% (the real bag holders)
Promoter bios? Chemical veterans who probably say, “Margins will recover,” while quietly dialing their brokers.
EduInvesting Verdict™
Laxmi Organic is a case study in how to turn promising chemical operations into shareholder chemistry experiments. Once touted as a growth story, the company is now stuck in the low-margin swamp.
Past Performance:
- Growth in early years was solid, but post-FY22, profits shrank faster than ice cream in Chennai summer.
Current Scenario:
- Margins crumbling, profits sliding, valuation sky-high.
- Promoter stake dip and FIIs’ lukewarm interest add to the spice.
Future Outlook:
- Capex could revive margins – but only if demand rebounds and costs behave.
- Specialty chemicals market is hot, but competition is hotter.
SWOT Analysis:
- Strength: Diverse product portfolio, global presence.
- Weakness: Weak margins, overvaluation.
- Opportunity: Specialty chemicals demand, new capex.
- Threat: Raw material price swings, global slowdown.
Final Word: Great company, average execution, expensive stock. Watchlist, don’t worship.
Written by EduInvesting Team | July 29, 2025
SEO Tags: Laxmi Organic, Specialty Chemicals, Q1 FY26 Results, LXCHEM Analysis, Stock Valuation


