Section 1 — At a Glance
The public market debut of a niche industrial player frequently reveals a stark divergence between immediate accounting growth and structural capital constraints. KSH International Limited’s Q4 FY26 and full-year performance highlights an extraordinary operational scale-up, alongside intensifying pressure on working capital. Driven by an unprecedented multi-year upcycle in the domestic power transmission and distribution (T&D) ecosystem, the company reported a headline quarterly revenue surge of 100.5% Year-on-Year, reaching ₹1,018 crore. This massive top-line expansion was mirrored by record quarterly profits after tax of ₹34.5 crore, indicating that structural demand from global and domestic transformer original equipment manufacturers (OEMs) remains intact.
However, behind these massive numbers lies an increasingly complex operational architecture. Despite delivering a 64% compounded growth in trailing twelve-month profits, KSH International’s expansion has consumed significant amounts of cash. Operating cash flow for FY26 deteriorated further to negative ₹65 crore, compared to negative ₹10 crore in FY25. This dynamic underscores a fundamental truth about industrial manufacturing: rapid volume growth in customized, high-specification segments requires aggressive upfront commitments to raw materials and prolonged receivable periods. As capital expenditure cycles peak with the commissioning of new facilities, investors must balance the company’s clear leadership in specialized Continuously Transposed Conductors (CTC) against an expanding balance sheet that demands careful management.
Exceptional top-line momentum can mask structural capital consumption, as accounting profits do not automatically translate into disposable liquidity during aggressive growth phases.
The critical variable going forward is whether management can successfully optimize its working capital cycle to stabilize internal cash generation.
Section 2 — Introduction
Fresh off its December 2025 initial public offering, KSH International finds itself positioned at the center of India’s electrical infrastructure build-out. Operating since 1979, the Pune-based manufacturer has evolved from a conventional wire drawer into the country’s largest exporter of specialized magnet winding wires. The timing of its listing was carefully chosen to capture structural tailwinds from domestic grid modernization, expanding renewable energy integration, and emerging demand from power-heavy AI data centers. Armed with ₹420 crore of fresh issue proceeds earmarked primarily for debt repayment and capacity expansion, the company is attempting to pivot to a higher asset tier. Its execution over the past few quarters indicates a strong appetite for volume capture, though the transition from a closely-held corporate entity to a publicly traded enterprise is already bringing its operational trade-offs into sharp focus.
Section 3 — Business Model: WTF Do They Even Do?
At its core, KSH International manufactures sophisticated copper and aluminum wires that prevent high-voltage power transformers from blowing up. This is not the standard household wiring used in residential buildings; it is heavy industrial engineering. The company takes raw copper and converts it into standard winding wires or hyper-specialized rectangular insulated conductors, particularly Continuously Transposed Conductors (CTC). These specialized components account for 75% of its total revenue mix and are utilized by massive transformer manufacturers like Siemens Energy, Hitachi Energy, and BHEL.
The primary business advantage here is an extensive pre-qualification lock-in. A new manufacturer cannot simply walk into a 765 kV or High Voltage Direct Current (HVDC) project and quote a lower price. Pre-qualification with major utilities like the Power Grid Corporation of India (PGCIL) or NTPC involves rigorous evaluation cycles that typically span five to seven years. Consequently, KSH operates in an environment with high entry barriers, maintaining a 94.54% repeat customer metric from a concentrated base of 122 clients.
Section 4 — Financials Overview
Figures are consolidated, in ₹ crore.
Quarterly Performance
| Metric | Q4 FY26 | YoY (%) | QoQ (%) |
| Revenue from Operations | 1,018.3 | 100.5% | 24.5% |
| EBITDA / Operating Profit | 56.3 | 59.9% | 14.0% |
| PAT | 34.5 | 86.5% | 48.1% |
| Reported EPS (₹) | 5.10 | 56.9% | 48.3% |
What is Management Promising in the Coming Quarters?
During the May 2026 earnings presentation, management expressed considerable confidence regarding volume trends for the upcoming fiscal year. With the greenfield facility at Supa now partly operational, the company anticipates an FY27 volume growth rate that will match or exceed the 21% expansion achieved in FY26.
Addressing the core dynamics of their financial model, the Managing Director noted:
“We decide on the value addition depending on the complexity… higher… like HVDC or 765kV, the value addition is obviously higher.”
The Chief Financial Officer also provided clear operational boundaries, stating that a sustainable EBITDA per metric ton range of ₹65,000 to ₹70,000 remains achievable on a long-term basis, provided the specialized product mix is maintained. Furthermore, the executive team is currently negotiating with financial institutions to extend payable terms up to 30 days by the end of the year, which they expect will significantly improve next year’s operating cash generation.
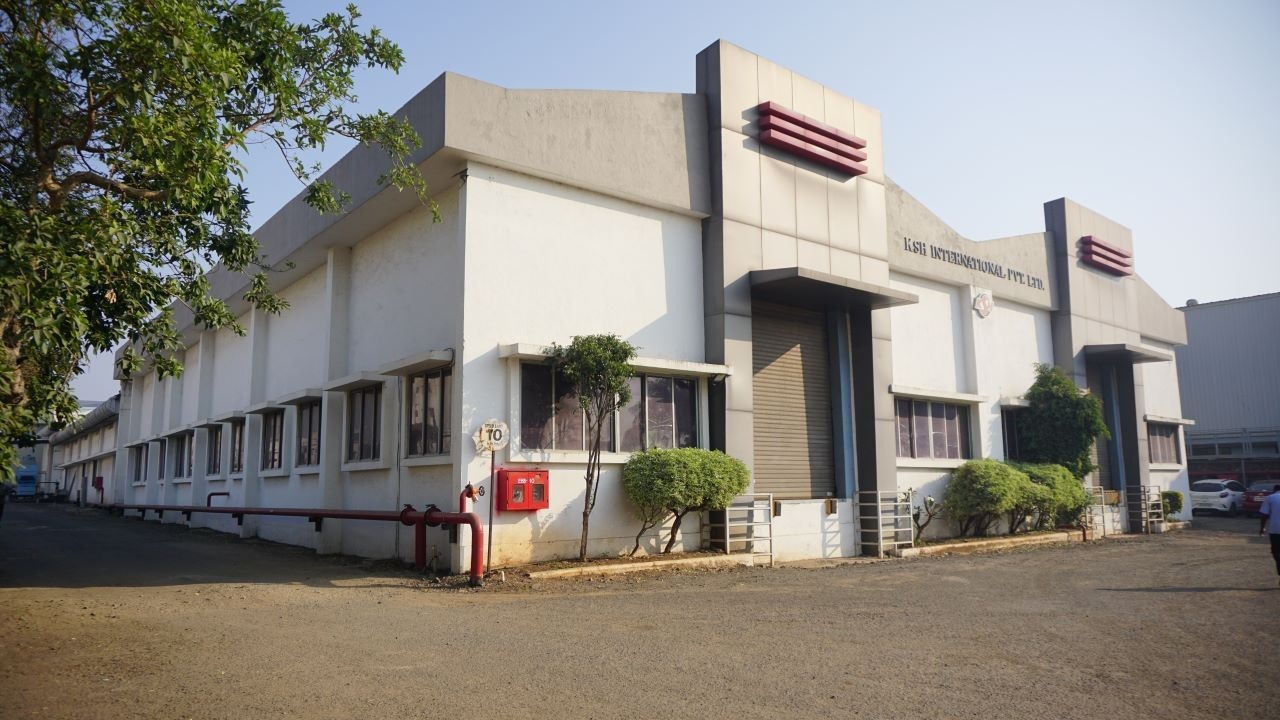
Predictable pricing structures insulate businesses from immediate commodity spikes but transfer the operational pressure entirely to inventory management and manufacturing throughput.
Section 5 — Valuation Discussion: Fair Value Range Only
To evaluate KSH International’s market position, we analyze valuation ranges based on its full-year FY26 results, adjusted for its post-IPO capital structure. With a current market price of ₹814 and a restated full-year EPS of ₹16.22, the trailing price-to-earnings (P/E) multiple stands at approximately 50.2x.
- P/E Method: Applying the historical peer multiple band of major electrical infrastructure players (ranging from a conservative 26x for mid-tier cable manufacturers to 54x for premium sector leaders like Polycab and KEI), and utilizing the full-year EPS of ₹16.22, implies an educational valuation range between ₹421 and ₹875 per share.
- EV/EBITDA Method: Utilizing the reported FY26 EBITDA of ₹192 crore against an Enterprise Value of ₹5,752 crore reveals a trailing multiple of 29.9x. Applying an industry-standard infrastructure multiple range of 18x to 28x suggests a normalized enterprise valuation zone.
- Discounted Cash Flow (Simplified): Assuming a near-term revenue growth rate of 20% supported by the ongoing Supa Phase II expansion, a stable operating profit margin of 6.18%, and a weighted average cost of capital of 11.5%, the valuation framework is highly sensitive to working capital outcomes. If the operating cash conversion remains negative past FY27, terminal value assumptions must adjust downward.
This fair value range is for educational purposes only and is not investment advice.
Section 6 — What’s Cooking: News, Triggers, Drama
The corporate landscape at KSH International has seen several meaningful adjustments over the last six months:
- Executive Leadership Restructuring: Chief Executive Officer Sandesh Bhagwat resigned effective March 31, 2026, and was replaced by industry veteran Hukumchand Lakhotiya on April 2, 2026.
- Promoter Transition: Joint Managing Director Rohit Kushal Hegde stepped down from his executive responsibilities on January 1, 2026, shifting to a Non-Executive, Non-Independent board role.
- Secretarial Leadership Change: Company Secretary Sarthak Malvadkar resigned from his compliance role on March 31, 2026, to transition into an alternative legal position within the group.
- Supa Facility Scale-up: Phase I of the greenfield project at Supa, Maharashtra, achieved full commercial operation, expanding the production footprint by 12,000 MTPA.
- Credit Rating Upgrade: CARE Ratings upgraded the company’s long-term bank facilities to ‘CARE A; Stable’ from ‘CARE A-‘, citing debt reduction following the IPO.
- Balance Sheet Deleverage: The company deployed a substantial portion of its IPO proceeds to pay down ₹225.9 crore of high-cost bank borrowings.
- Captive Renewable Integration: A new 3.2 MW rooftop solar installation at the Supa plant was commissioned, bringing total captive solar capacity to 4 MW to lower manufacturing power costs.
Section 7 — Balance Sheet
The corporate balance sheet reflects the structural shifts brought about by the recent equity injection.
| Item | Mar 2024 | Mar 2025 | Mar 2026 |
| Total Assets | 483 | 745 | 1,323 |
| Net Worth (Equity + Reserves) | 282 | 554 | 8,081 |
| Borrowings | 214 | 366 | 321 |
| Other Liabilities | 38 | 80 | 193 |
| Total Liabilities | 483 | 745 | 1,323 |
Balance Sheet Observations
- The company’s net worth line effectively transformed post-IPO, expanding from ₹554 crore to ₹8,081 crore, primarily driven by substantial share premium inflows.
- While absolute borrowings dropped from ₹366 crore to ₹321 crore, the liability line continues to carry short-term working capital debt required to fund raw material purchases.
- The asset base shows an increase in cash and cash equivalents, which reached ₹721 crore as of March 31, 2026, providing a short-term liquidity buffer for ongoing projects.
A well-capitalized balance sheet provides structural support, but it cannot permanently offset inefficient operational asset turnover.
Does a large cash balance solve a low operating margin problem, or simply postpone the operational adjustments needed to fix it?
Section 8 — Cash Flow: Sab Number Game Hai
The movement of cash highlights the functional realities of a fast-growing manufacturing business.
| Year | Operating CF | Investing CF | Financing CF |
| FY24 | -17 | -39 | 67 |
| FY25 | -10 | -118 | 123 |
| FY26 | -65 | -179 | 306 |
The Cash Journey
The operational cash trajectory shows widening deficits despite increasing accounting profits. In FY26, KSH generated a record profit before tax of ₹146 crore, yet its cash from operating activities fell to negative ₹65 crore. This gap is directly tied to an accumulation of inventory, which grew to ₹425 crore, and trade receivables, which reached ₹333 crore. Because transformer OEMs demand bulk production shipments delivered in specific sequences, KSH must commit capital to raw copper long before invoices are settled. Investing cash outflows of ₹179 crore reflect the physical build-out of the Supa production lines, leaving the business entirely reliant on financing cash flows—via IPO proceeds and short-term banking lines—to bridge the gap.
When rapid revenue expansion systematically outpaces cash collection, a business model requires continuous external financing to sustain basic daily operations.
Section 9 — Ratios: Sexy or Stressy?
Evaluating the core operational ratios provides a clearer look at the underlying financial performance.
| Ratio | Value | Verdict |
| ROE (%) | 20.1% | Efficient on historical capital, but faces near-term dilution from the expanded equity base. |
| ROCE (%) | 21.4% | Satisfactory capital productivity reflecting strong asset utilization across the older plants. |
| P/E (Recalculated) | 50.2x | High growth expectations are fully priced in, leaving little room for operational errors. |
| PAT Margin (%) | 3.54% | Slim profitability profile typical of processing-heavy models, highly sensitive to fixed cost changes. |
| Debt to Equity | 0.39x | Materially improved post-IPO, removing near-term leverage risk from the credit profile. |
Section 10 — P&L Breakdown: Show Me the Money
A multi-year review of the profit and loss statement shows the financial impact of expanding capacity.
| Year | Revenue | EBITDA | PAT |
| FY24 | 1,383 | 72 | 37 |
| FY25 | 1,928 | 123 | 68 |
| FY26 | 3,107 | 192 | 110 |
The P&L Story
The multi-year trajectory shows a significant scale-up in operations, with revenue growing from ₹1,383 crore in FY24 to ₹3,107 crore in FY26. However, operating profit margins remained tight, moving marginally from 5.2% to 6.18%. Because copper constitutes roughly 90% of total operating costs, the business operates with a low value-addition architecture. Absolute EBITDA expanded to ₹192 crore in FY26, driven by higher absolute volumes and an improved share of specialized products. Profit after tax reached ₹110 crore, but the low structural margin profile leaves the bottom line vulnerable to any underutilization at the newly commissioned Supa plant.
Section 11 — Peer Comparison
The industrial cable and wire peer landscape highlights the specific margin dynamics within this sector.
| Company | Revenue (₹ Cr) | PAT (₹ Cr) | P/E Multiple | ROCE (%) | OPM (%) |
| Polycab India | 28,883.8 | 2,672.0 | 53.8x | 34.3% | 13.9% |
| KEI Industries | 11,747.8 | 918.4 | 54.9x | 20.1% | 10.5% |
| R R Kabel | 9,722.4 | 506.4 | 44.9x | 28.1% | 8.1% |
| KSH International | 3,106.9 | 111.4 | 50.2x | 21.4% | 6.18% |
KSH International commands a premium growth multiple close to industry giants like Polycab and KEI, despite operating with lower operating profit margins (6.18% vs Polycab’s 13.9%). This valuation reflects the company’s concentration in specialized transformer winding wires rather than consumer-centric retail cables.
Section 12 — Miscellaneous: Shareholding & Promoters
The post-IPO equity ownership split has settled into a standard institutional structure.
| Holder | Ownership % |
| Promoters | 74.58% |
| Institutions (FII + DII) | 18.95% |
| Public | 6.47% |
The promoter group, led by Chairman Kushal Subbayya Hegde, retains the maximum allowable statutory stake of 74.58%. Institutional validation is led by domestic mutual funds, with Kotak Mahindra Mutual Fund holding 5.34% and LIC Mutual Fund keeping a 2.81% stake. The public float remains tight at 6.47%, which can contribute to higher volatility in daily equity trading volumes.
Section 13 — Corporate Governance: Angels or Devils?
The governance profile presents a mix of positive financial disciplines alongside notable personnel shifts. On the positive side, the complete absence of promoter share pledging and the timely deployment of IPO proceeds to reduce bank facilities align with clean balance sheet management. However, the simultaneous departure of the Chief Executive Officer, the Joint Managing Director, and the Company Secretary within a single fiscal quarter introduces operational transition risks. Additionally, the company’s annual secretarial compliance report filed on May 27, 2026, noted a minor compliance exception involving an employee share pledge during a closed trading window. While non-material to financials, these sequential human capital movements require close monitoring over the coming quarters.
Section 14 — Industry Roast & Macro Context
Operating in the magnet winding wire industry means tethering your financial destiny to the highly cyclical world of heavy electrical infrastructure. The entire sector is currently benefiting from global grid upgrades, but it remains structurally vulnerable to volatile raw material costs. Because copper forms the absolute foundation of the cost structure, processing companies must constantly manage London Metal Exchange price fluctuations. While pass-through mechanisms exist, any friction in supply chains—such as the shipping delays encountered in the Middle East during March—directly impacts quarterly inventory build-ups, forcing manufacturers to step into the working capital market to preserve production schedules.
Section 15 — EduInvesting Verdict
KSH International presents a clear investment case defined by strong volume momentum, which is counterbalanced by visible cash flow pressures typical of rapid industrial scaling.
SWOT Analysis
| Strengths | Weaknesses |
| • Market leadership in specialized CTC wires. • Strong entry barriers with 5-7 year utility approval cycles. | • Negative operating cash flows driven by working capital investment. • Thin net profit margin profile (3.54%). |
| Opportunities | Threats |
| • Greenfield capacity expansion via Supa Phase II. • Growing demand from AI data centers and global T&D markets. | • Heightened vulnerability to volatile global copper prices. • Near-term execution risks from recent senior executive transitions. |
The company’s operational runway remains intact, but the short-term performance will depend on its ability to turn accounting profits into actual positive cash flow.
True investment durability is proven when a company successfully converts top-line accounting momentum into sustainable, internally generated free cash flow.
