1. At a Glance
CMP ₹793, market cap ₹2,569 Cr, P/E 30.5, EV/EBITDA 12x, book value ₹277, ROE 9.3%, ROCE 12.5%. Debt stands at ₹202 Cr, dividend yield 0.35%. In FY25, sales ₹694 Cr, PAT ₹84 Cr, OPM ~29%. Over 3 years, stock delivered +18%, but in the last 1 year, it’s down ~6%. Investors are basically in “MRI mode” — lying still, hearing loud noises, and waiting for the report.
2. Introduction
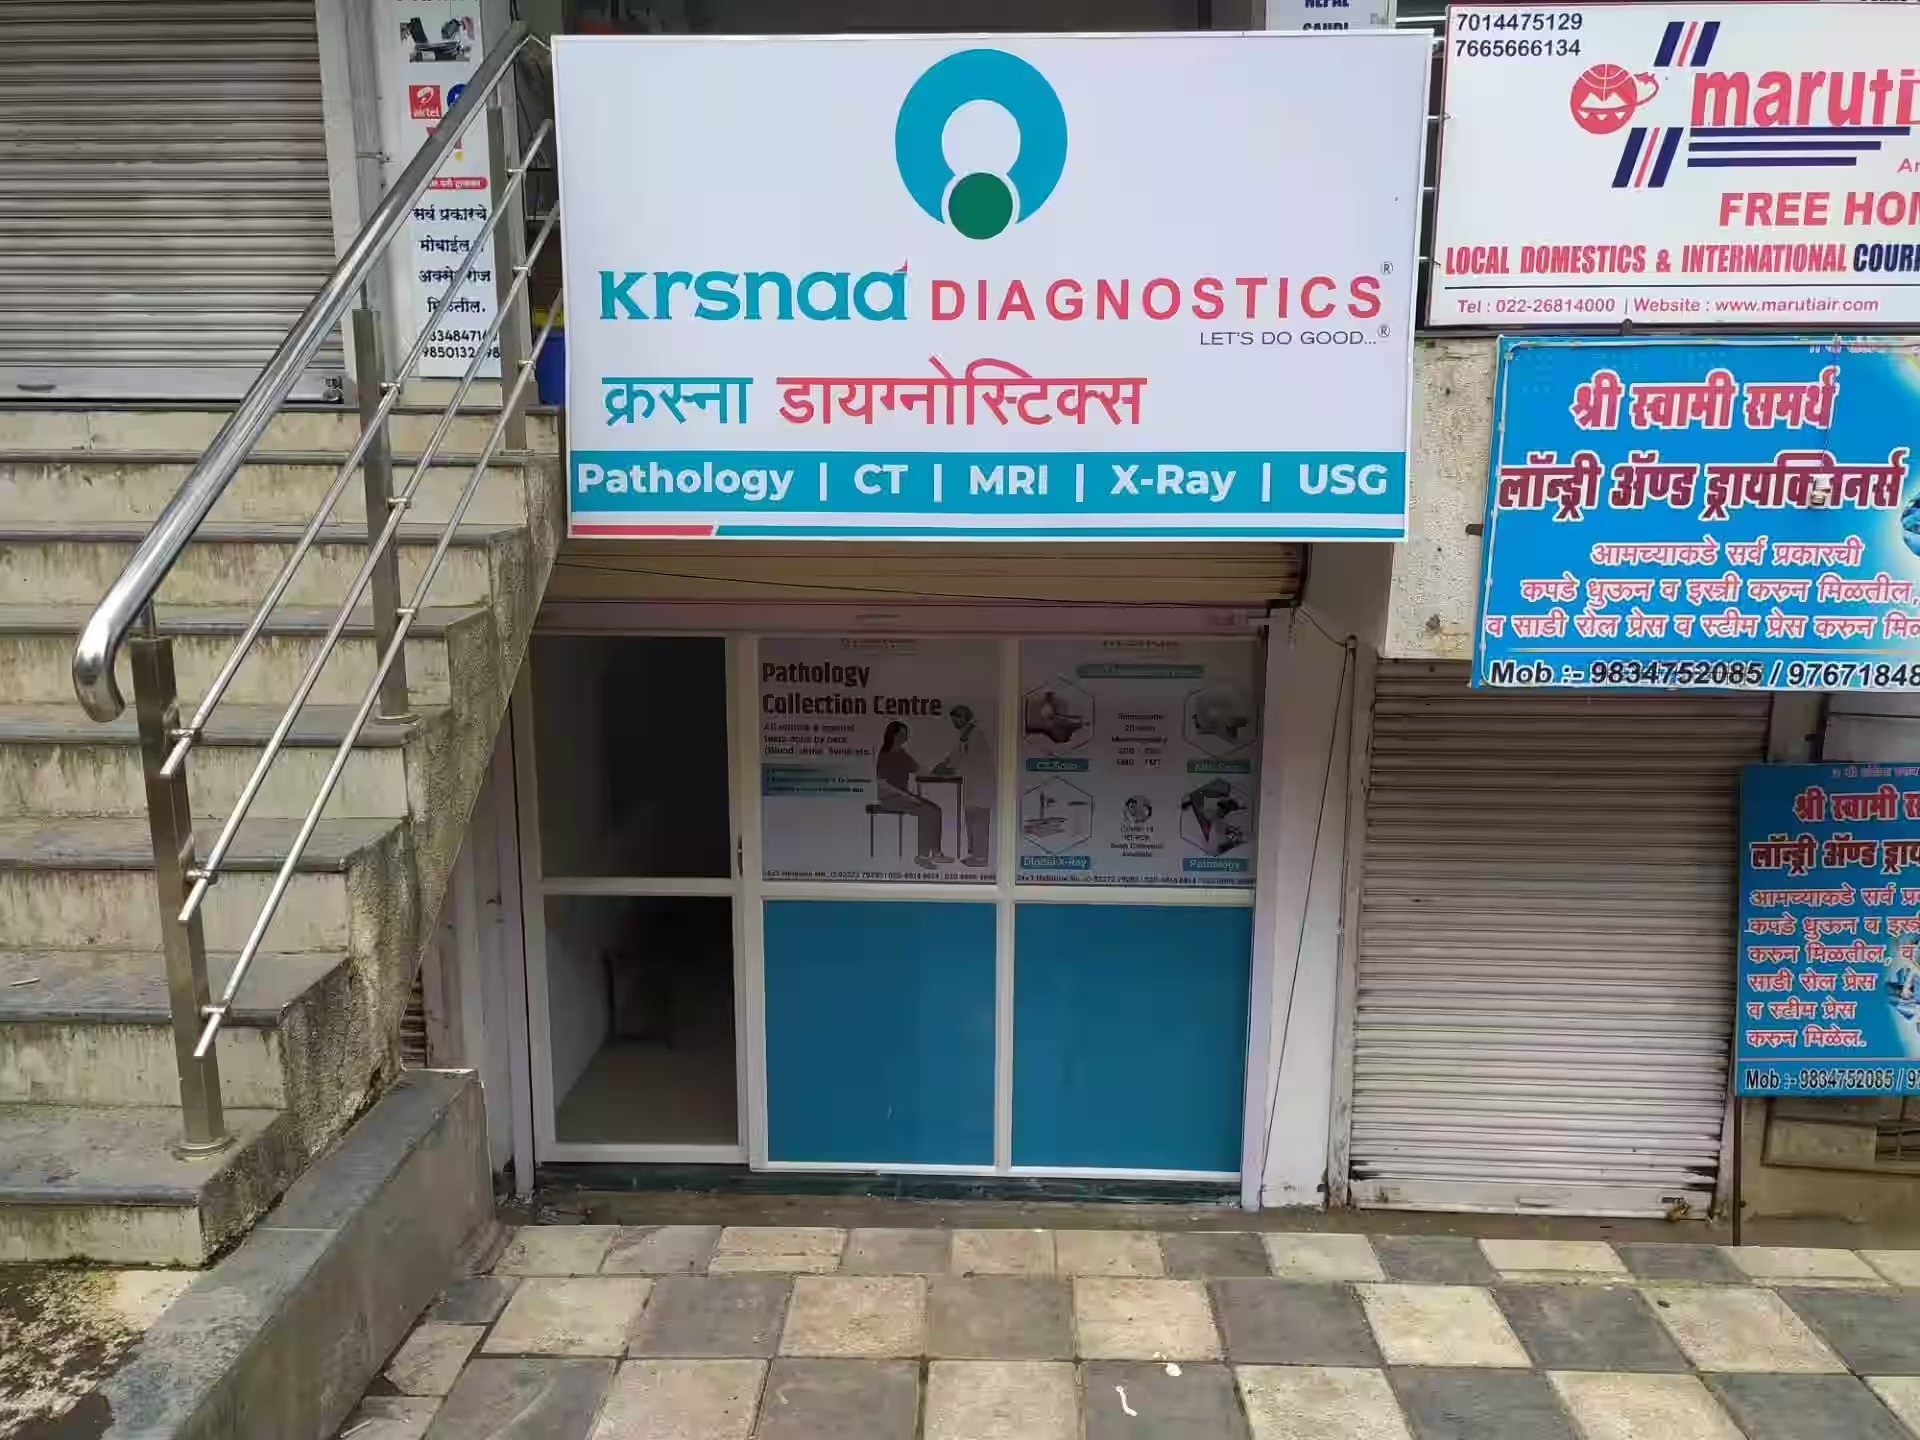
Krsnaa Diagnostics is not your average “blood test at corner lab” story. It’s a PPP (Public-Private Partnership) behemoth. This company built its empire by bidding for government contracts to run CT, MRI, X-ray, and pathology centers in hospitals and medical colleges across India. Basically, they’re like the “Byju’s of diagnostics” — aggressive bidding, fast expansion, and half their customers don’t directly pay.
Except unlike Byju’s, Krsnaa has an actual business model that works (most of the time). Radiology brings 57% revenue, pathology 43%. They handle 1.5 lakh CT/MRI scans per month, process 6 lakh X-rays monthly, and have served 40 million patients in the last 3 years. That’s almost the population of Canada — except here, people don’t go back smiling with maple syrup; they leave with CT scans.
But there’s a catch — 75% of revenue comes from PPP contracts. Which means they depend on sarkari payment timelines. Receivable days? 152 last year. Government contracts are like Indian weddings: big promises, long delays, and money coming only when all relatives sign the cheque.
3. Business Model – WTF Do They Even Do?
Lazy investor decoding:
- Radiology: 178 MRI centers, 1,434 reporting hubs, NABH-accredited teleradiology hub. In desi language, they can scan your brain even from 1,000 km away.
- Pathology: 121 labs, 3,423 collection centers, 26 accredited centers. Basically, your blood travels more than you do.
- PPP Model: Tie-ups with state & central government. Hospitals provide space, Krsnaa sets up machines. 78% tender win rate. They’re the “first bencher” who always gets chosen for group projects.
- Private Tie-ups: 42+ centers with private hospitals. Think Apollo, Fortis, but on rent.
- Retail Foray: 80 Krsnaa Brand Associates already, target 500 by FY26. Finally learning to deal directly with aam junta, not just babus.
- Cost Leadership: Prices 60–80% lower than market. Cheap, affordable, volume-driven. Diagnostic equivalent of “Ola Share.”
👉 Question: Would you trust a PPP model where government pays late but volumes are massive, or a retail model where margins are fat but competition is