General information and entertainment, not investment advice. The author is not a SEBI-registered adviser or research analyst. No recommendation, no promised returns. Markets carry risk including loss of capital. Figures may not be current. Consult a registered adviser before acting.
1 — At a Glance
Kreon Finnancial Services closed the year ended March 2026 with revenue of ₹38.68 crore and a net profit of ₹7.26 crore — a swing from the ₹4.14 crore loss booked a year earlier. On the surface, a clean recovery. One line down the page complicates the applause: other income for the year was ₹4.68 crore, against a profit before tax of ₹9.91 crore. Nearly half the pre-tax profit sat outside the lending business.
Underneath sits a ₹161 crore NBFC that lends small, short, and mostly to college students through an app called StuCred. Bad debts written off during the year ran to ₹10.9 crore — larger than the entire revenue of two years ago. The company grew its top line 46%, and simultaneously wrote off a fortune in loans that didn’t come back.
A lender is a machine for turning capital into interest income without turning it into losses. The year’s numbers show both halves of that machine running hard. Which one wins the argument is the whole entry below.
2 — Introduction
Incorporated in 1994, Kreon spent roughly two decades as a traditional lender before the business took its current shape. Registered as a non-deposit-taking NBFC and classified as an Investment and Credit Company, it now runs two segments: commercial lending and digital lending.
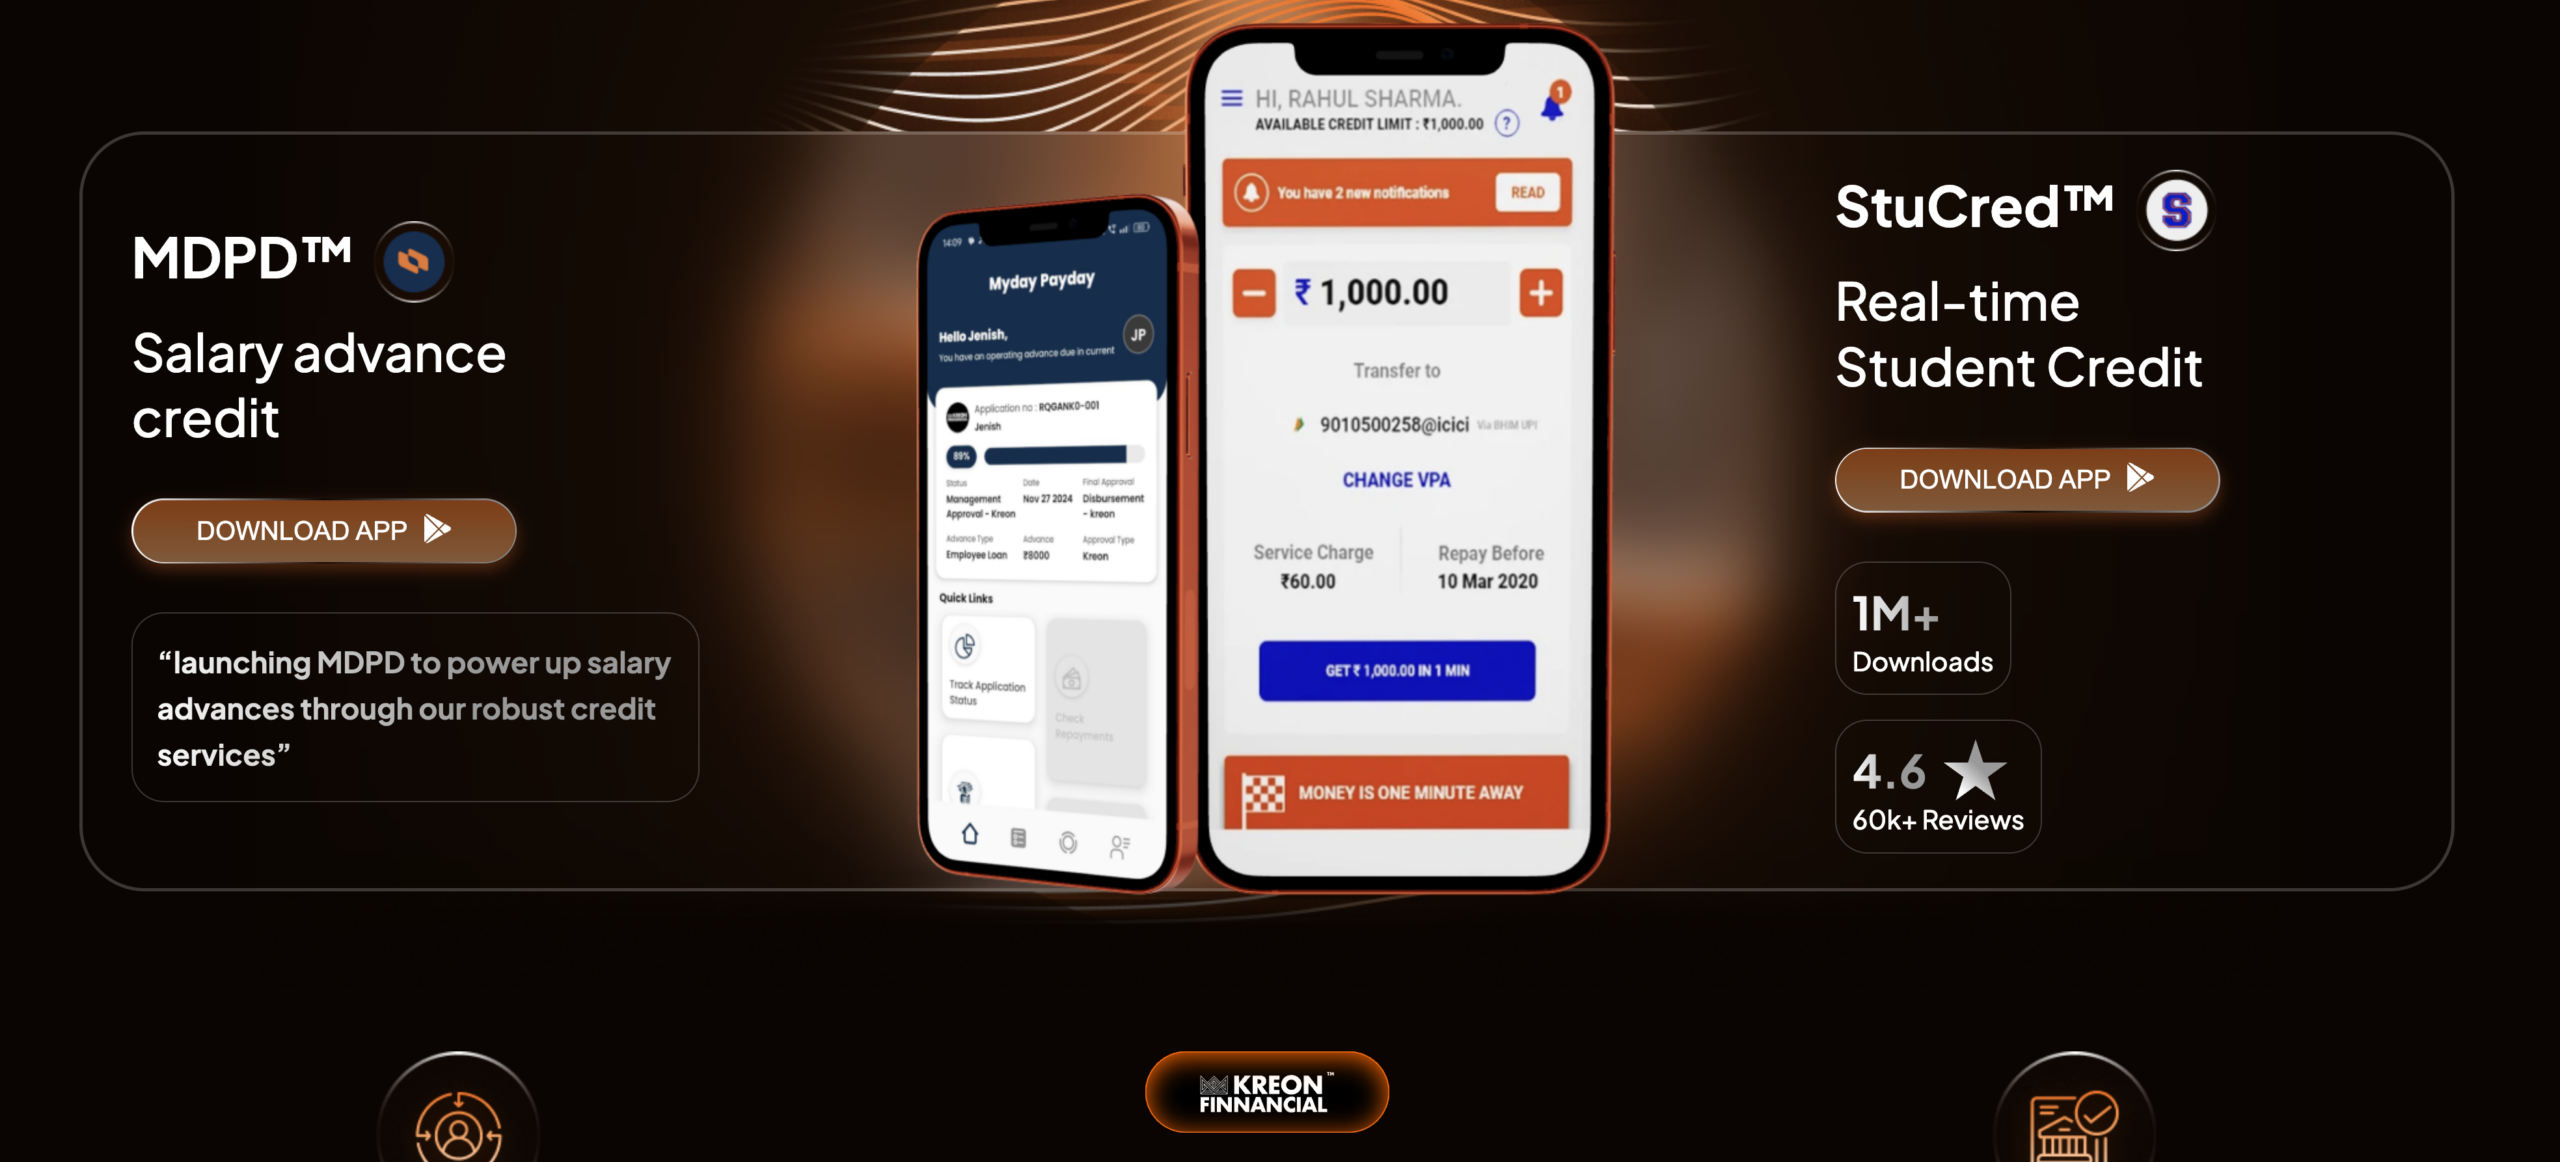
The digital arm is the story. In 2019 the company built an in-house app, StuCred, offering short-term unsecured credit to students of affiliated colleges — loans of small ticket size and up to 90-day tenure. By the disclosures on record it counts roughly 21,000 college tie-ups and around 197,000 active StuCred users.
The recent period has been busy off the balance sheet as well. A new Chairman and Managing Director, Jaijash Tatia, took over in August 2024. In February 2026 the board appointed a Chief Strategy Officer at ₹75 lakh per annum — the CMD’s spouse, a related-party matter the entry returns to. And in June 2026, the promoter group and the company itself both went shopping for shares. The financials recovered; the corporate calendar stayed loud.
3 — Business Model: WTF Do They Even Do?
Kreon lends money to college students through a phone. That is the compressed version, and it is not unfair.
The mechanics: StuCred extends instant, small, unsecured loans to students at affiliated colleges, credit period up to 90 days, renewable on request. The revenue mix on record is the interesting part — application-usage fees dominate, loan-related fees add a large slice, and actual interest on loans is a thin sliver. This is a lender whose income statement leans more on fees than on the spread between what it borrows and what it lends.
That design has consequences. Fee-led, high-velocity, small-ticket consumer credit is a volume game with a collections problem stapled to it. The FY26 accounts make the staple visible: ₹10.9 crore of bad debts written off, plus ₹1.4 crore recovered from previously written-off loans and parked in other income. Money goes out the door fast; some of it walks back in through a different door labelled “recovery.”
The company also describes itself investing in AI and ML for credit assessment. For a book built on unsecured student lending, credit assessment isn’t a feature — it’s the entire load-bearing wall. Does an app-fee revenue model survive its own default rate, or just outrun it for a while? The write-offs suggest the wall is being tested.
4 — Financials Overview
Figures are consolidated, in ₹ crore. (Latest period: quarter ended March 2026.)
| Metric | Latest Q (Q4 FY26) | YoY (Q4 FY25) | QoQ (Q3 FY26) |
|---|---|---|---|
| Revenue | 10.13 | 7.21 | 9.94 |
| Operating Profit | -0.11 | -0.96 | 1.49 |
| PAT | 0.36 | -0.79 | 1.07 |
| EPS (₹) | 0.18 | -0.39 | 0.53 |
Revenue climbed 40% year-on-year in the March quarter. Operating profit, however, was negative — the quarter’s operating line came in at -₹0.11 crore, an improvement on the prior year’s -₹0.96 crore but a step down from the ₹1.49 crore of the preceding quarter. The ₹0.36 crore of net profit for the quarter arrived with ₹1.62 crore of other income doing the heavy lifting. Sequentially, both operating profit and PAT stepped down from Q3.
The full-year picture is stronger than the closing quarter: FY26 revenue ₹38.68 crore, PAT ₹7.26 crore, reported EPS ₹3.59. The statutory auditors issued an unmodified opinion on the year’s results. The gap between a healthy year and a soft final quarter is where the reader’s attention earns its keep.

5 — Market Expectations & Historical Multiples
This section describes how the market is currently pricing the company and how that compares with its own history and peer group. It is descriptive, not predictive.
| Metric | Current | Historical Average | Peer Median |
|---|---|---|---|
| P/E | 22.2x | — | 22.8x |
| P/B | 4.5x | — | — |
| ROE | 21.7% | 8.8% (5-yr) | 9.7% (ROCE, peers) |
| ROCE | 18.4% | — | 9.7% |
The market pays about 22x earnings here, almost exactly the peer median of 22.8x — an unremarkable multiple for a lender. The more striking number is the P/B of 4.5x: the market values the equity at four and a half times its stated book. Against that, the company’s five-year average ROE of 8.8% sits far below the 21.7% posted in FY26.
What the market appears to be pricing is the FY26 snapshot — 46% revenue growth, a return to profit, and a one-year ROE that towers over the five-year average — rather than the fuller through-cycle record, which includes a loss as recent as FY25. A P/B above 4x on a book that swung to a loss two years ago is the market extending credit to the recovery, not to the history. The single factual observation: the current earnings multiple matches peers, while the book-value multiple prices in a continuation of FY26’s returns rather than the five-year run-rate.
6 — What’s Cooking
The March-2026 results (unmodified audit opinion) are the headline, but June 2026 was where the corporate action clustered.
The promoter group bought in. Opti Products Private Limited, a promoter-group entity, acquired 9,98,123 shares on 3–4 June 2026 in the open market, worth ₹3.14 crore, lifting aggregate promoter holding from 55.60% to 60.54%. Days later, on 9 June, Kreon itself crossed 9.05% in Kairosoft AI Solutions after buying 15,870 more shares — the NBFC taking a stake in a separate listed AI-solutions company.
Earlier in the year, the February appointment of a Chief Strategy Officer at ₹75 lakh per annum — the CMD’s spouse — went through a shareholder postal ballot, passed 20 March 2026. Each of these is a real, disclosed event; none is a rumour. Promoters adding ₹3 crore of their own money and the company deploying capital into an unrelated AI listing are two very different uses of confidence, arriving in the same fortnight.
7 — Balance Sheet
| Item | FY24 | FY25 | FY26 |
|---|---|---|---|
| Total Assets | 63.38 | 66.22 | 76.59 |
| Net Worth | 32.88 | 30.95 | 36.08 |
| Borrowings | 27.97 | 31.66 | 37.14 |
| Other Liabilities | 2.53 | 3.61 | 3.37 |
| Total Liabilities | 63.38 | 66.22 | 76.59 |
Assets equal liabilities in every column, as they must.
- Borrowings rose from ₹27.97 crore to ₹37.14 crore over two years — a lender growing its book by growing its debt, which is the job description, not a surprise.
- Net worth dipped in FY25 (the loss year) then recovered to ₹36.08 crore, tracking the profit line exactly.
- Cash and bank stood at ₹9.25 crore against ₹37.14 crore of borrowings — this is a net-debt balance sheet, not a net-cash cushion.
A balance sheet that grows debt faster than it grows equity is fine while the loans perform. The whole risk lives in that qualifier.
8 — Cash Flow: Sab Number Game Hai
| Year | Operating | Investing | Financing |
|---|---|---|---|
| FY24 | -1.27 | -25.12 | 28.01 |
| FY25 | -2.29 | -0.68 | 1.15 |
| FY26 | -7.15 | 7.72 | 0.52 |
Operating cash flow has been negative for three straight years, deepening to -₹7.15 crore in FY26 even as reported profit turned positive. For a growing lender this is structural — cash goes out as loans, and disbursement growth outruns collections on the cash statement. FY26 financing inflow was a modest ₹0.52 crore, meaning the growing loan book leaned on the balance sheet rather than fresh external funding this year. Reported profit and cash generation are pointing in opposite directions — the number to keep one eye on.
9 — Ratios: Sexy or Stressy?
| Ratio | Value |
|---|---|
| ROE | 21.7% |
| ROCE | 18.4% |
| P/E | 22.2x |
| PAT Margin | 18.8% |
| D/E | 1.03 |
ROE of 21.7% for FY26 is a strong single-year figure — but the three-year ROE sits at 3.93% and the five-year at 8.83%, so the equity has spent most of the recent past working part-time and only recently clocked full hours. ROCE of 18.4% comfortably clears the peer set. PAT margin of 18.8% flatters a business whose profit carried ₹4.68 crore of non-operating income. D/E of 1.03 is modest for an NBFC — leverage here is not the pressure point; loan quality is.
10 — P&L Breakdown: Show Me the Money
| Year | Revenue | Other Income | PAT | EPS (₹) |
|---|---|---|---|---|
| FY24 | 16.37 | 0.00 | 0.62 | 0.31 |
| FY25 | 26.53 | 0.11 | -4.14 | -2.05 |
| FY26 | 38.68 | 4.68 | 7.26 | 3.59 |
The Other Income column is the entry’s spine. In FY24 and FY25 it was negligible; in FY26 it jumped to ₹4.68 crore — including ₹1.4 crore of recovered bad debts — against a full-year profit before tax of ₹9.91 crore. The business scaled revenue impressively across the three years, and the return to profit is real, but a meaningful chunk of the FY26 bottom line came from outside core lending operations.
EPS moved in step with PAT across the window (share count was stable at 2.02 crore shares through FY24–FY26), so the EPS swing from -₹2.05 to ₹3.59 reflects the profit swing, not a share-count trick. Revenue tripled in three years; the quality of the profit riding on top of it is the open question the trajectory leaves behind.
11 — Peer Comparison
| Company | Revenue (Qtr) | PAT (Qtr) | P/E |
|---|---|---|---|
| Bajaj Finance | 21,605.79 | 5,553.30 | 33.8x |
| Shriram Finance | 12,513.43 | 3,020.95 | 25.0x |
| Muthoot Finance | 9,288.71 | 3,397.48 | 11.8x |
| L&T Finance | 4,771.03 | 809.16 | 27.9x |
| Kreon Finnancial | 10.13 | 0.36 | 22.2x |
The scale gap is the joke that writes itself: Kreon’s quarterly revenue of ₹10.13 crore sits beside peers reporting quarterly PAT in the thousands of crores. On multiple, Kreon’s 22.2x lands mid-pack — below Bajaj and L&T, above Muthoot — which prices a ₹161 crore niche student-lender on roughly the same earnings multiple as diversified giants many hundreds of times its size. The peer table’s median P/E of 22.8x is effectively where Kreon trades; everything distinguishing the two lives in scale, book quality, and diversification, none of which the multiple captures.
12 — Miscellaneous: Shareholding & Promoters
| Holder | % (Mar 2026) |
|---|---|
| Promoters | 55.60 |
| Institutions | ~0 |
| Public | 44.40 |
Promoter holding stood at 55.60% at year-end, held largely across the Tatia family and associated entities — Jaijash Tatia (CMD), Henna Jain, and Tatia Global Vennture among them. Institutional ownership is essentially nil; this is a promoter-and-retail register with no fund sponsorship. After year-end, the June 2026 open-market buying by promoter-group entity Opti Products lifted the aggregate stake to 60.54% — promoters increasing their own exposure with cash, which is at least a directionally honest signal from insiders about insiders.
13 — Corporate Governance: Angels or Devils?
The statutory auditors, Darpan & Associates, issued an unmodified opinion on the FY26 results — the clean end of the spectrum. The record is not spotless, though, and the entry reports what the filings state.
Two items stand out. First, related-party proximity: the Chief Strategy Officer appointed in early 2026 at ₹75 lakh per annum is the spouse of the Chairman and Managing Director — a related-party appointment, disclosed and put to a shareholder ballot. Second, compliance friction: BSE levied fines for delayed related-party-transaction disclosures, once in December 2025 and again in early 2026, with the board minuting corrective measures. The company also changed statutory auditors in the recent past. None of these is fatal on its own; together they describe a governance setup where the family sits on both sides of several tables and the disclosure clock has been missed more than once.
14 — Industry Roast & Macro Context
Unsecured small-ticket digital lending is the segment regulators watch most closely and least fondly. The economics are seductive — high fees, fast turnover, an app instead of a branch — and the hazard is equally famous: a default cycle that arrives all at once when the borrower base is young, thin-file, and correlated. Student lending compounds the correlation; college cohorts share income timing, exam calendars, and job-market luck.
The sector rewards distribution and collections in equal measure, and the second is harder than the first. Any lender in this space is one tightening cycle or one funding squeeze away from discovering how sticky its loan book really is. The dynamics are structural, not company-specific gossip — but they are precisely the dynamics a ₹10.9-crore write-off year makes concrete.
15 — EduInvesting Verdict
| Strengths | Weaknesses |
|---|---|
| 46% revenue growth; return to ₹7.26 Cr profit | ₹4.68 Cr other income props up ₹9.91 Cr PBT |
| Modest D/E of 1.03; unmodified audit | 3-yr ROE just 3.93%; ₹10.9 Cr bad debts written off |
| Opportunities | Threats |
| Large addressable student-credit base | Unsecured book, collections risk, RPT/compliance flags |
| Promoters adding stake with own cash | Three years of negative operating cash flow |
Kreon spent FY26 doing two things at once: growing a student-lending book at 46% and writing off a book’s worth of bad loans, then closing the gap with recoveries and other income. The result is a genuine profit whose composition invites the very scrutiny the growth rate was meant to end. A lender that has to explain half its pre-tax profit is a lender the market is pricing on faith in the other half.
Rapid growth on one side of the ledger, ₹10.9 crore of write-offs on the other — the year balanced, but the question of which side is the real business stays open.