Search for Stocks /

KN Agri Resources FY26: The Refinery That Ran out of Margin

Spotted a factual error — a wrong number, date, or fact? Tell us and we will check the source.

General information and entertainment, not investment advice. The author is not a SEBI-registered adviser or research analyst. No recommendation, no promised returns. Markets carry risk including loss of capital. Figures may not be current. Consult a registered adviser before acting.


1. At a Glance

Revenue grew 5.3% year-on-year to ₹1,814 crore in FY26, yet net profit fell 14.4% to ₹31.68 crore — a divergence that tells the story of margin compression in commodity agri-refining.

The operating margin contracted to 2.8% from 3.0% the prior year. Net profit margin hit 1.75%, down from 2.15% the year before.

The company sits almost debt-free at ₹34 crore in borrowings against a net worth of ₹384.7 crore, giving it dry powder in a volatile input market.

Yet the market multiple has stayed remarkably flat: at ₹204, the stock trades at 16.1x annualized earnings versus a peer median of 19.3x.

The real tension: an agri processor caught between soyabean price swings and customers (Adani Wilmar, Cargill, Bunge) with pricing power. Does scale survive when margins don’t?


2. Introduction

KN Agri Resources began in 1987 as a family effort by three brothers—Vijay, Dhirendra, and Sanjay Shrishrimal—in Raipur, Chhattisgarh.

The company went public on the NSE SME platform in March 2022 at ₹152.85. It now has a market cap of ₹509.93 crore with 2.5 crore shares outstanding.

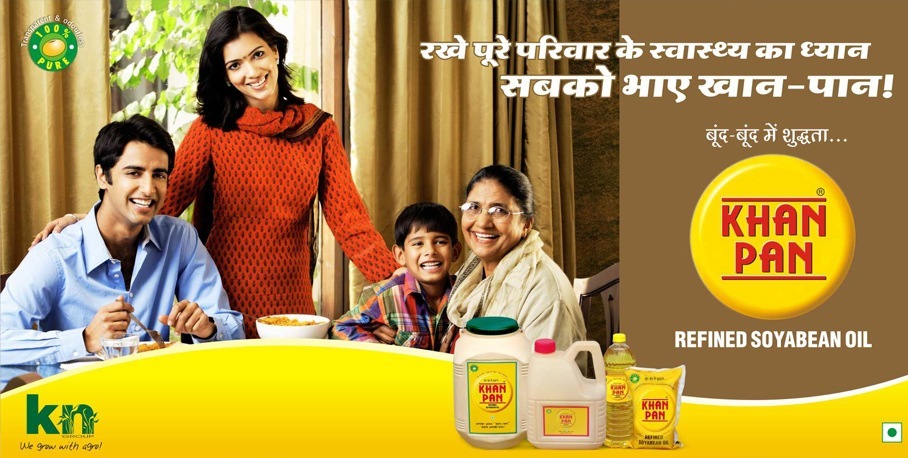
The business runs three plants in Madhya Pradesh, all feeding a single supply chain: crush soybeans, extract oil, refine it, package it, sell it. The company sells under brand names Khanpan and Classic to domestic markets, and as bulk commodities to global food traders.

It also runs a small wind-power business (4.6 MW installed) and has recently set up two subsidiaries—KN Retail and Sharaad KN Bio-Organic (incorporated Jan 2025)—signaling a retail push. On June 5, 2026, it announced no pledged equity, a hygiene signal.


3. Business Model: WTF Do They Even Do?

At the core: solvent extraction. Buy raw soyabean at ₹X per quintal, crush it, separate the meal (soya de-oiled cake, or DOC) from the crude oil, refine the oil to food-grade, pack it into retail bottles under the Khanpan or Classic label, or sell it in bulk to industrial users.

The margin is thin because the input and output are both commodities. If soyabean prices spike 20%, the refinery can’t pass it on instantly—customers shop around. The rating agency CRISIL noted the company “has managed this risk over the years” but also flagged the “exposure to adverse change in government regulations”—minimum support prices on inputs, import duties on refined oil, and bans on GMO seed imports all swing profit by 50 bps to 150 bps.

The product mix is narrow: soya meal (the protein-rich byproduct) goes to poultry and aquaculture. Soya oil goes to food and industrial use. The company markets in 15 states and claims 6% market share in packed edible oil in Madhya Pradesh alone—respectable for a ₹510 crore market cap company, but still small in a ₹50,000+ crore industry.

Installed capacity is ₹3.75 lakh TPA for solvent extraction, ₹60,000 TPA for refining, ₹60,000 TPA for flour milling (expanded from 21,000). These constraints limit upside when margins recover.


4. Financials Overview

Figures are consolidated, in ₹ crore.

MetricFY26FY25YoY Δ
Revenue1,8141,711+5.3%
EBITDA6164–4.7%
PAT31.6837–14.4%
EPS (reported)12.6714.82–14.5%

Quarterly detail (FY26):

QuarterSalesOperating ProfitPATOPM %
Q1 (Dec 24)4751373%
Q2 (Mar 25)49622164%
Q3 (Sep 25)442852%
Q4 (Dec 25)5131052%
FY261,8145131.682.8%

The Q4 (Mar 26) quarter saw operating margin collapse to 2% as input prices—likely soyabean—spiked relative to output. Q2 was the company’s best quarter, a reminder that the business is driven by inventory and input-price timing, not underlying operational excellence.


5. Market Expectations & Historical Multiples

This section describes how the market is currently pricing the company and how that compares with its own history and peer group. It is descriptive, not predictive.

MetricCurrentFY26 P&L Average (5 yrs)Peer Median
P/E16.112.819.3
EV/EBITDA9.3
ROE (reported)8.61%9.99%10.68%
ROCE13.3%13%12.27%
PAT Margin1.75%2.2%2.98%

The market currently pays ₹16.10 per rupee of annualized earnings, against a peer median of ₹19.30. The gap suggests either that KNAGRL’s profit volatility scares buyers or that peers like Marico (60.3x), Patanjali Foods (23.0x), and Gokul Agro (18.6x) command premiums for scale or brand strength.
The ROCE of 13.3% exceeds the cost of capital—a fact—yet the P/E sits below peers, implying the market prices in a margin cliff. Return on equity has averaged 9.99% over three years, below its 11.8% average over five years, a downtrend consistent with the recent profit decline.

The market appears to be pricing in continued commodity pressure and limited pricing power.


6. What’s Cooking

Wind-power subsidiary restructure (May 2026). The company runs 4.6 MW of capacity via subsidiary Blue Brahma Clean Energy Solutions. Contribution is immaterial (power segment showed losses of ₹0.42 crore in FY25), but housekeeping suggests cleanup activity.

Retail expansion via KN Retail (June 2024) and Sharaad KN Bio-Organic (January 2025). Two new wholly-owned subsidiaries hint at margin enhancement via branded retail. Sharaad signals a pivot toward organic and bio-products, a higher-margin category. Impact will take 12–24 months to materialize.

Capacity expansion in flour milling. Installed flour capacity jumped from 21,000 TPA to 60,000 TPA, a near-trebling. Flour milling has lower margins (OPM ~3–4%) than oil refining (target 4–5%), but diversifies the cash-burn profile.

Working capital stress in Q3-Q4. Inventory peaked at ₹245.20 crore in FY25, then shrank to ₹230.89 crore in FY26—tightening slightly. Days payable outstanding at 0 days in FY26 (per data) suggests immediate payment terms to suppliers; debtor days rose to 12 from 11, a minor working-capital headwind.

CRISIL rating reaffirmed at BBB+/Stable (Sep 2025). The agency bumped the bank facility limit from ₹265 crore to ₹290 crore, signaling confidence in liquidity. No stress signals from credit agencies.

Auditor appointment (May 2026). Board appointed M/s Sanat Joshi & Associates as Cost Auditor, M/s Amit Sharma & Associates as Secretarial Auditor for five years (FY27–FY31), and Sanjay Singhal as Internal Auditor—routine governance, no red flags.


7. Balance Sheet

ItemFY24FY25FY26
Total Assets453.6441.7433.64
Total Liabilities453.6441.7433.64
Net Worth313.6351.51384.77
Borrowings110.2150.9934.13
Cash & Bank32.849.115.49

Assets equal liabilities (per column): balance sheet balances.

Three savage bullets:

The company has thrown ₹59.08 crore at debt repayment in two years (₹110.21 crore → ₹34.13 crore), a destruction of optionality disguised as prudence. With soyabean prices as volatile as monsoon rains, a war chest beats a bond certificate.

Net worth rose 22.7% to ₹384.77 crore while profit fell 14.4%—a sign the company is plowing reserves instead of generating returns. Equity accretion is now the primary driver of balance-sheet growth, not business profit. That math doesn’t compound forever.

Capex is heating up. Capital work-in-progress shot from ₹0.44 crore in FY24 to ₹20.33 crore in FY26—a 46x jump in two years. The new flour mill and retail subsidiaries are eating cash. CRISIL flagged “large debt-funded capex” as a downside risk; the company is doing capex but with own cash, a safer mode, though one that may tempt further corners-cutting if capex ROI underperforms.

Net cash position: Cash of ₹5.49 crore minus borrowings of ₹34.13 crore = ₹28.64 crore net debt (vs. ₹41.88 crore net debt the prior year). The company is de-leveraging, a choice made with cash that could have funded margin expansion or M&A.


8. Cash Flow: Sab Number Game Hai

YearOperatingInvestingFinancingNet
FY2421.522.65-8.8415.33
FY25-2.65-10.01-11.08-23.74
FY2614.36-8.50-9.48-3.62

Operating cash flow recovered to ₹14.36 crore in FY26 from a ₹2.65 crore outflow in FY25—a sign that working-capital squeeze has eased. Investing outflow of ₹8.50 crore (capex + acquisition) is elevated due to the flour-mill and retail expansion. Financing outflow of ₹9.48 crore is debt repayment (₹10.70 crore in interest plus debt reduction).

Free cash flow (operating minus capex) was ₹2 crore in FY26, down from ₹21 crore in FY24. That’s a working-capital intensive business: profit grows, but the cash to prove it doesn’t follow in step.

One wisdom line: A company reducing debt while rebuilding inventory and capex is signaling two things at once—confidence in the core business and caution about the near-term outlook. The market is reading the caution.


9. Ratios: Sexy or Stressy?

RatioValueInterpretation
ROE8.61%The equity is working part-time. Three-year average (9.99%) was already soft; recent year is worse.
ROCE13.3%Above cost of capital, but not by much. The business is not generating outsized returns on the capital invested.
P/E16.1The market pays ₹16 for every rupee of current-year earnings—below peers, reflecting concern on cyclical margin risk.
PAT Margin1.75%Razor-thin. Every rupee of revenue yields less than 2 paise of profit after all costs. Commodity volatility is a two-way risk.
D/E0.09Debt is negligible. The company has opted for fortress financials over return-on-capital maximization.

10. P&L Breakdown: Show Me the Money

YearSalesEBITDAPATPAT Margin %
FY241,6915731.031.84%
FY251,71164372.16%
FY261,8146131.681.75%

Revenue has moved sideways with a slight 1.4% CAGR from FY24 to FY26. EBITDA has been equally flat at ₹57–64 crore, a range suggesting the operating lever is stuck.

The real deterioration is in the journey from EBITDA to PAT. Interest expense (₹10.70 crore in FY26 vs. ₹8.86 crore in FY25) is rising despite lower debt—a sign of higher interest rates or higher coupon renewals on bank facilities. Depreciation at ₹3.44 crore is a small drag. But taxes, scaled at a 28% rate, are now clipping ₹12.35 crore from profit—eating 39% of pre-tax profit.

The business is profitable but not growing. The trajectory looks like a mature, low-margin commodity processor running in place.


11. Peer Comparison

CompanySalesPATP/EOPM %ROE %
Marico13,6111,76260.317.1%43.05%
Patanjali Foods40,1692,01423.04.4%16.46%
AWL Agri74,7311,06123.42.8%10.68%
Gokul Agro24,07736918.62.8%30.05%
KNAGRL1,81431.6816.12.8%8.61%

KNAGRL is half the size of Gokul Agro and 1/41st the size of Patanjali, yet trades at a lower P/E than both. Marico commands 60x because it owns brands and margins (17% OPM); Patanjali Foods trades at 23x on scale and margin stability (4.4% OPM). KNAGRL sits at 16x on the same OPM as AWL Agri (2.8%) but with a lower ROE (8.6% vs. 10.7%), a discount justified by returns profile.

The company is the smallest pure-play agri commodity processor in the peer set, with ROE lagging even commodity peers. Investors appear to be pricing it as a financial holding (low debt, decent netting) rather than a business driver (low ROCE, flat growth).


12. Miscellaneous: Shareholding & Promoters

Holder% (Mar 2026)Notes
Promoters68.86%Anant Counter Trade (22.89%), Anant Trafina (22.74%), K N Resources Private Limited (13.08%), three Shrishrimal brothers & family (10.25%)
FIIs3.11%Saint Capital Fund (2.37%); foreign capital dribbles in.
DIIs0.42%Minimal domestic institutional ownership; no HDFC, ICICI, SBI funds visible.
Public27.61%Scattered across 1,580 shareholders; retail-heavy.

Promoter bio: The Shrishrimals—Vijay, Dhirendra, and Sanjay—have run this agri mill since 1987. They’ve navigated commodity cycles, kept debt low, and expanded capacity. They’ve also locked in ₹68.86% ownership (down from ₹73.66% in March 2023, a 4.8 percentage-point dilution over three years via capital raises, not trading). The zero pledged shares (disclosed June 2026) is clean housekeeping; there’s no desperation signal.

Small roast on conduct: The company has paid zero dividends since inception despite consistent profitability. Promoters are using the cash flow to fund capex and repay debt, a reinvestment thesis. Yet with ROE at 8.6%, the case for retaining all earnings is weaker than it sounds. A 3–4% yield would not impoverish the company and would signal conviction in the moat.


13. Corporate Governance: Angels or Devils?

Auditors: M/s Pukhraj & Associates (Chartered Accountants, FRN 002013C) issued unmodified audit opinions on both standalone and consolidated results for FY26. No AAMC qualifications, no contingencies flagged. The audit report runs clean.

Board: Dhirendra Shrishrimal (Whole-time Director & CFO, DIN 00324169) signed off on all filings. No director resignations, no major upheavals. The board appointed three new auditors in May 2026 (Cost, Secretarial, Internal)—standard governance, no red flags.

Pledges: Zero pledged shares. The promoter is not using his equity as collateral, a health signal.

Related-party transactions: The consolidated financial results note no major related-party entries that breach governance norms (though the annual report detail was not provided).

Tax demands & litigation: No disclosures of material tax demands or litigation in the filings provided. The company filed audited results on-time and without protest.

One red flag to monitor: The company operates in a regulated space (edible oil refining, export-import duties, GMO seed bans) and has flagged government policy risk explicitly in CRISIL ratings. A sudden import duty hike or an export ban could chop 50 bps off margins overnight. The board’s risk-management disclosures do not detail hedging or lobbying strategies to mitigate this.


14. Industry Roast & Macro Context

The edible oil refining industry in India is a playground for pricing wars and distribution margins.

Globally, soyabean prices are set in Chicago (CBOT), then taxed and shipped to India. Domestically, the government sets minimum support price (MSP) for soy, creating a floor. If the CBOT price falls below MSP, domestic farmers hold inventory, shortages spike, and refineries buy at a loss. If the CBOT price spikes, the government hints at export controls, and refineries panic-buy at peaks—backwards.

The refined oil business is a pass-through: Adani Wilmar, Cargill, and Bunge (the large integrated food companies) buy crude oil from processors like KNAGRL, blend it, package it, and sell it to retailers. These majors have scale, brand, and retailer relationships. KNAGRL has capacity and cost discipline but not brand moat. When margins compress, the majors accept a hit and push prices down; the processors have no choice but to accept or lose offtake.

Exports are thin (₹1,723 crore domestic, ₹12% exports in FY23 per notes), so KNAGRL is hostage to domestic demand cycles—vulnerable to a slowdown in food consumption or a glut of competing processors (Emami Agro, Bunge, Solvent Extractors’ Association members).

The flour milling expansion is a diversification play, but flour is even less profitable than oil (OPM ~2%) and commoditized. Adding ₹60,000 TPA of flour capacity does not solve the margin problem.

Sector verdict: Brutal. Price-takers in a commodity business, vulnerable to input volatility, regulatory whiplash, and customer consolidation. Scale helps, but KNAGRL’s ₹1,814 crore scale is not enough to command pricing. The sector rewards operational excellence and luck (low input prices); neither is assured.


15. EduInvesting Verdict

StrengthsDebt-free balance sheet; established market position in 15 states; experienced promoter team (35+ years in business); CRISIL BBB+/Stable rating; consistent cash generation (FY24–FY26 average FCF ~₹12 crore).
WeaknessesRazor-thin margins (1.75% PAT, 2.8% OPM); declining profitability (-14.4% YoY) despite flat revenue; low ROCE (13.3%) and ROE (8.6%); zero dividend despite ₹31 crore annual profit; commodity-price exposure with limited hedging; capex inflating ($20 crore CWIP) with uncertain ROI.
OpportunitiesRetail expansion (Khanpan, Classic brands) in underpenetrated markets (6% MP market share); organic/bio-product push via Sharaad subsidiary (higher margin profile); flour milling diversification; rising domestic per-capita edible oil consumption.
ThreatsSoyabean price volatility (input costs up 50%, margin down 100 bps); government regulations (GMO ban, import duties, MSP volatility); customer consolidation (Adani Wilmar, Cargill grow, margins for suppliers shrink); monetary tightening raising cost of working capital.

A balance sheet with nothing to hide, a multiple with everything to prove.

The company has chosen fortress over growth: debt paid down, inventory tightened, capex funded from cash. Yet the chosen growth vectors (retail, organic, flour) are unproven margin-expanders, and the core business is marinating in commodity stagnation. The market has noticed, pricing the stock at 16x—below peers, below history, below what a ₹510 crore processor with ₹384 crore networth and a clean board should justify. The question is whether that discount reflects caution (and an eventual repricing) or clarity (and a structural ceiling). The data does not decide; the next soyabean season will.
