1.At a Glance
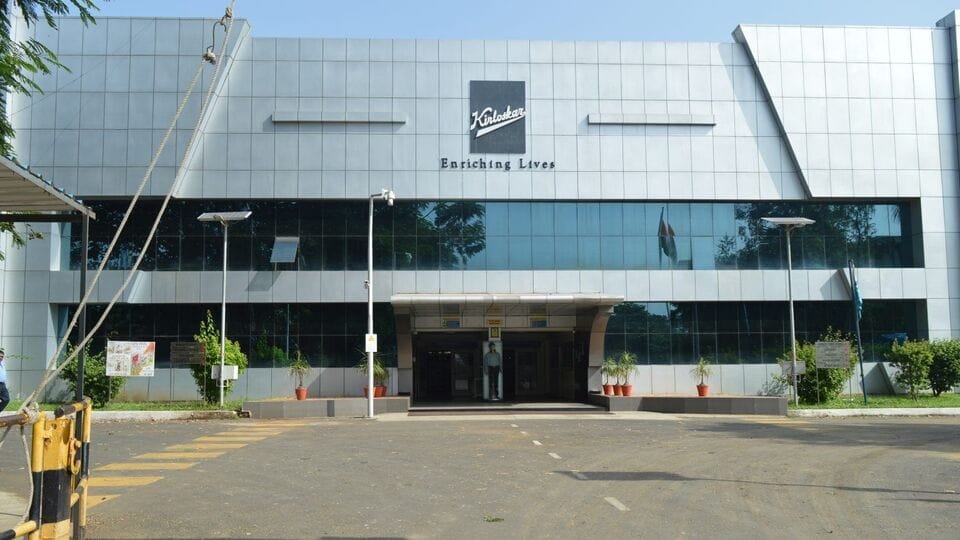
Kirloskar Industries Ltd (KIL) is the landlord-industrialist hybrid of the Kirloskar group — holding assets in iron castings, wind energy, investments, and a property portfolio that includes prime land in Pune, New Delhi, and Jaipur. It owns 51% ofKirloskar Ferrous Industries Ltd(KFIL), which brings in 92% of group revenue. The rest is rent, dividends, and the occasional gust of wind power revenue. At aP/E of 26, trading at0.66x book value, and ROE stuck at 2.6%, it’s not the fastest-growing engine in the Kirloskar stable.
2.Introduction
This isn’t your average engineering company. KIL is more of a strategic landlord and investor than a pure manufacturer. The group’s industrial muscle comes from KFIL, while the holding company earns through dividends, rent, and small operational inputs. The charm? Legacy assets. The curse? Low returns relative to its asset base — think of it as a vintage muscle car driven at 40 km/h.
3.Business Model (WTF Do They Even Do?)
- Iron Castings:Through KFIL (51% stake), manufacturing pig iron and castings.
- Real Estate:Leasing properties to group companies and others.
- Investments:Securities and inter-group holdings.
- Wind Power:Small capacity plants — more green PR than cash cow.
The standalone entity survives largely onpassive income— in FY25, 90%+ of standalone revenue came from dividends and property licensing.
4.Financials Overview
- TTM Revenue:₹6,755 Cr (consolidated)
- TTM Net Profit:₹338 Cr
- EBITDA Margin:~12%
- ROCE:6.72% |ROE:2.60%
- P/E:26 |Book Value:₹6,045 (CMP/BV 0.66x)
Recalculating P/E using Q1 FY26 annualised EPS:
- Q1 EPS = ₹42.10 → Annualised = ₹168.4 → P/E ≈ 23.6 (a tad cheaper than the trailing).
5.Valuation – Fair Value RANGE
| Method | Basis | FV Range (₹) |
|---|---|---|
| P/E Multiple | Industrial avg ~18x on EPS ₹168 | 2,800 – 3,100 |
| EV/EBITDA | Sector avg 10x on EBITDA ₹808 Cr | 3,000 – 3,300 |
| SOTP | KFIL stake + property value | 3,200 – 3,500 |
Fair Value Range:₹2,800 – ₹3,500This FV range is for educational purposes only and is not investment advice.
6.What’s Cooking – News, Triggers, Drama
- Q1 FY26 PAT up 44% YoYat ₹95.4 Cr (consolidated).
- Exceptional Gain:₹2.51 Cr in Q1 from asset adjustments.
- Subsidiary Liquidation:Non-core clean-up underway.
- Leadership Moves:Aditi Kirloskar
