General information and entertainment, not investment advice. The author is not a SEBI-registered adviser or research analyst. No recommendation, no promised returns. Markets carry risk including loss of capital. Figures may not be current. Consult a registered adviser before acting.
1. At a Glance
For nine months, Kesar Petroproducts read like a turnaround finally arriving. Through December, the pigments maker had stacked up ₹14.74 crore of profit — roughly double the same stretch a year earlier — on the back of a swing from crude to higher-margin pigments. Then the March quarter arrived and posted a net loss of ₹5.06 crore, dragging full-year FY26 profit to ₹9.68 crore, a shade below FY25’s ₹9.96 crore. A year that spent three quarters climbing spent its fourth quarter handing the gains back.
The full-year revenue barely moved: ₹187.22 crore against ₹185.17 crore. Operating profit for the year landed around ₹21 crore, yet the Q4 line alone turned negative at ₹1.12 crore operating and worse after a deferred-tax charge. The market currently pays about 20x earnings on the enlarged share base, close to the peer median.
The tension worth watching: a company that told investors Q4 would be “very strong” instead delivered its only loss quarter of the year. What does a 9M doubling mean when the year ends flat?
2. Introduction
Kesar Petroproducts was incorporated in 1990 and makes Phthalocyanine Blue Crude and its downstream pigments from a plant cluster at Lote Parshuram, in Maharashtra’s chemical belt. It holds roughly a 15% share of India’s copper phthalocyanine market and exports to about 55 countries.
The recent chapter has been busy. In April 2025 the board appointed Shreyas Sharma as CEO. In June 2025 Infomerics upgraded the bank-facility rating to IVR BBB/Stable from BBB-/Stable, citing improved scale and profitability. Through the year the company pushed a strategic shift — management’s phrase, repeated across calls, was moving “from a crude manufacturer” to “a pigment manufacturer,” with co-products like complex fertiliser layered on top. A large capital-work-in-progress balance sat on the books through FY25 and was capitalised during FY26, pushing net block from ₹63.94 crore to ₹134.95 crore.
Then came the tariff quarter. Management attributed Q4 weakness to US-India tariff developments that “created temporary pressures on volumes and markets,” delaying export orders — the CEO said so on the February call. That, plus higher depreciation and finance costs on the newly capitalised plant, is the backdrop to the loss.
3. Business Model: WTF Do They Even Do?
They turn copper and intermediates into blue. Specifically, CPC Crude Blue and its activated form feed downstream into Alpha Blue (15.0, 15.1), Beta Blue (15.3, 15.4) and Pigment Green 7. Per the FY25 mix on the investor presentation, CPC Crude was 45% of revenue and pigments 55% — which is the whole strategic story in two numbers, because management says crude margins run “around 1% to 2%” while pigment margins run “around 15% to 18%.” Selling more of the second and less of the first is the entire plan.
Geographically, FY25 revenue split roughly 60% exports and 40% domestic, with the export basket spread across South-East Asia, Europe, the USA and Latin America. End-uses run through paints, plastics, inks, rubber and textiles. Distribution leans on seven-to-eight distributors carrying 60% of sales, with the rest direct to manufacturers.
The newer wrinkle is co-products. The pigment process throws off by-products, and management’s argument — validated on the call — is that being able to handle those by-products is what lets you scale pigments in the first place. So they built a technical-grade complex fertiliser line (for drip irrigation, guided at 3,600 MTPA and ₹30–40 crore of potential revenue) and are planning a zinc phosphate plant later. There is also a leased-capacity arrangement: Kesar leases 1,500 MT/month of CPC Blue capacity from Shreyas Intermediates on a lease running more than twelve years, the CEO confirmed. A pigment maker, a fertiliser maker, and a tenant, all at once.
Does a ₹30–40 crore fertiliser line move the needle for a ₹187 crore company, or is it mostly a way to unclog the pigment plant’s drains?
4. Financials Overview
Figures are standalone, in ₹ crore.
| Metric | Latest Q (Mar 2026) | YoY (Mar 2025) | QoQ (Dec 2025) |
|---|---|---|---|
| Revenue | 46.47 | 40.99 (+13.4%) | 41.02 (+13.3%) |
| Operating Profit | -1.12 | 4.96 | 6.28 |
| PAT | -5.06 | 1.98 | 2.92 |
| EPS (₹) | -0.52 | 0.20 | 0.30 |
Revenue actually grew both year-on-year and sequentially. Everything below the top line went the other way: operating profit flipped from ₹6.28 crore the prior quarter to negative ₹1.12 crore, and a deferred-tax charge of ₹2.21 crore deepened the reported loss to ₹5.06 crore. Per the audited filing, cost of materials consumed jumped sharply in the quarter even as sales rose — the figure sits in the results statement. Management framed the weakness as order deferrals from tariff uncertainty rather than lost demand, and told the February call demand was “back to the previous two” quarters.

Concall (Feb 2026): Management maintained full-year guidance of “100% bottom line growth year-over-year with 15% to 16% EBITDA margins” and expected Q4 to be “very strong.” The reported Q4 arrived as a loss. Longer-term, the CEO reiterated a target of “18% to 20% CAGR top line growth for the next three years.” These are management’s projections, quoted as such.
5. Market Expectations & Historical Multiples
This section describes how the market is currently pricing the company and how that compares with its own history and peer group. It is descriptive, not predictive.
| Metric | Current | Historical Average | Peer Median |
|---|---|---|---|
| P/E | 20.2 | — | 22.7 |
| EV/EBITDA | 11.3 | — | — |
| P/B | 1.15 | — | — |
| ROE | 6.60% | 4.16% (5-yr) | — |
| ROCE | 7.46% | — | 9.47% |
The market currently pays about 20x earnings here versus a peer median of 22.7x, and 1.15x book. On returns, current ROE of 6.60% sits above the company’s own five-year average of 4.16%, while ROCE of 7.46% remains below the peer-set median of 9.47%.
What the market appears to be pricing is the nine-month profitability jump and the guided story around it — the mix shift toward pigments, the fertiliser and co-generation ramp, and management’s forecast of normalisation after the tariff quarter — rather than the loss the fourth quarter actually reported. The multiple sits near the peer median even though the latest quarter’s return profile does not.
One factual observation on expectations: the price the market pays rests on a share count that grew after year-end, while the FY26 earnings underneath it were struck on the older, smaller count.
6. What’s Cooking
The loudest recent event is a capital one. On June 8, 2026, the board allotted 1.5 crore equity shares to the promoter group on conversion of convertible warrants at ₹18.80 each, taking in ₹21.15 crore. In the same meeting, 52 lakh warrants held by promoter and non-promoter holders lapsed for non-payment, and the ₹2.44 crore of upfront money on them was forfeited. Paid-up capital rose to ₹11.17 crore.
Before that, in September 2025, the company received Consent to Operate from the Maharashtra Pollution Control Board for its co-generation power plant at Ratnagiri. The complex-fertiliser line began commercial production during the December quarter, per management, with no revenue contribution in that quarter and “some contribution, for sure, in Q4.” Each of these is a real filing, reported at its reported size — no forecast attached.
7. Balance Sheet
| Item | Mar 2024 | Mar 2025 | Mar 2026 |
|---|---|---|---|
| Total Assets | 208.75 | 238.29 | 245.07 |
| Net Worth | 124.45 | 143.88 | 149.46 |
| Borrowings | 55.17 | 72.93 | 72.26 |
| Other Liabilities | 29.13 | 21.48 | 23.35 |
| Total Liabilities | 208.75 | 238.29 | 245.07 |
Assets equal liabilities in every column, as they must.
- Net block nearly doubled from ₹63.94 crore to ₹134.95 crore, while capital work-in-progress fell from ₹56.08 crore to ₹16.61 crore — the plant that was “in progress” for years finally moved onto the fixed-asset line during FY26.
- Borrowings held roughly flat at ₹72.26 crore after climbing steadily from ₹20.76 crore in FY22; the debt build-up funded the capex, and it has stopped rising rather than reversed.
- Cash and bank fell to ₹14.5 crore from ₹29.94 crore, leaving a net-debt position of roughly ₹58 crore against those borrowings.
Reserves grew every year straight through the profit wobble, because the company has never paid a dividend. Money that stays in the building tends to stay in the building.
8. Cash Flow: Sab Number Game Hai
| Year | Operating | Investing | Financing |
|---|---|---|---|
| Mar 2024 | -20.21 | -4.03 | 25.25 |
| Mar 2025 | 13.16 | -14.88 | 10.90 |
| Mar 2026 | 30.48 | -28.17 | -9.83 |
The trace is coherent for once. FY26 operating cash of ₹30.48 crore was the strongest in years, nearly all of it consumed by ₹28.17 crore of investing outflow as the capex was paid for. Financing turned negative as borrowings were trimmed and cash left the building. A year where the business generated real cash and spent it on plant, rather than borrowing to cover operations — the FY24 pattern of negative operating cash plugged by financing is the one that’s gone.
9. Ratios: Sexy or Stressy?
| Ratio | Value |
|---|---|
| ROE | 6.60% |
| ROCE | 7.46% |
| P/E | 20.2 |
| PAT Margin | 5.2% |
| D/E | 0.48 |
ROE at 6.60% means the equity is working, but part-time — it clears its own five-year average and little more. ROCE of 7.46% tells the same story on the fuller capital base, which now includes all that freshly capitalised plant that hasn’t yet earned a full year of output. The PAT margin of 5.2% is thin but real for a business where nearly half of revenue still comes from 1–2% margin crude. D/E of 0.48 sits comfortably below one, consistent with the rating agency’s read of a comfortable financial risk profile.
10. P&L Breakdown: Show Me the Money
| Year | Revenue | Operating Profit | Other Income | PAT | EPS (₹) |
|---|---|---|---|---|---|
| Mar 2024 | 148.86 | 2 | 7.67 | 4.98 | 0.52 |
| Mar 2025 | 185.17 | 16 | 2.48 | 9.96 | 1.03 |
| Mar 2026 | 187.22 | 21 | 1.52 | 9.68 | 1.00 |
Look at FY24’s row and the Other Income column earns its keep. Operating profit that year was about ₹2 crore, while other income was ₹7.67 crore — meaning the reported ₹4.98 crore of profit leaned more on non-operating gains than on making pigments. By FY26, operating profit had grown to roughly ₹21 crore while other income shrank to ₹1.52 crore. The profit is broadly flat across FY25 and FY26 (₹9.96 crore to ₹9.68 crore), but its composition got dramatically healthier — the earnings are now the business rather than the sidelines.
EPS moved in step with PAT (₹1.03 to ₹1.00), both struck on 9.67 crore shares. Worth flagging for what comes next: the June 2026 warrant conversion added 1.5 crore shares after the year closed, so the same rupee of future profit will be spread across a larger base.
11. Peer Comparison
| Company | Sales Qtr | PAT Qtr | P/E |
|---|---|---|---|
| SRF | 4,615.17 | 582.02 | 43.3 |
| Deepak Fertilisers | 3,011.38 | 139.39 | 27.7 |
| Tata Chemicals | 3,438.00 | -2,116.00 | 64.8 |
| GNFC | 2,208.00 | 396.00 | 9.7 |
| GHCL | 790.51 | 115.64 | 8.8 |
| Kesar Petroproducts | 46.47 | -5.06 | 20.2 |
The scale gap is the headline: Kesar’s quarterly revenue is a rounding error next to SRF or Tata Chemicals. On the multiple, Kesar’s ~20x sits below the peer median of 22.7x, but it earns that placement on a loss-making quarter while GNFC and GHCL trade under 10x on solid quarterly profits. It is a small commodity-chemicals name priced closer to its larger specialty peers than to its bargain-multiple ones.
12. Miscellaneous: Shareholding & Promoters
| Holder | % (Mar 2026) |
|---|---|
| Promoters | 63.23 |
| Institutions | 0.15 |
| Public | 36.63 |
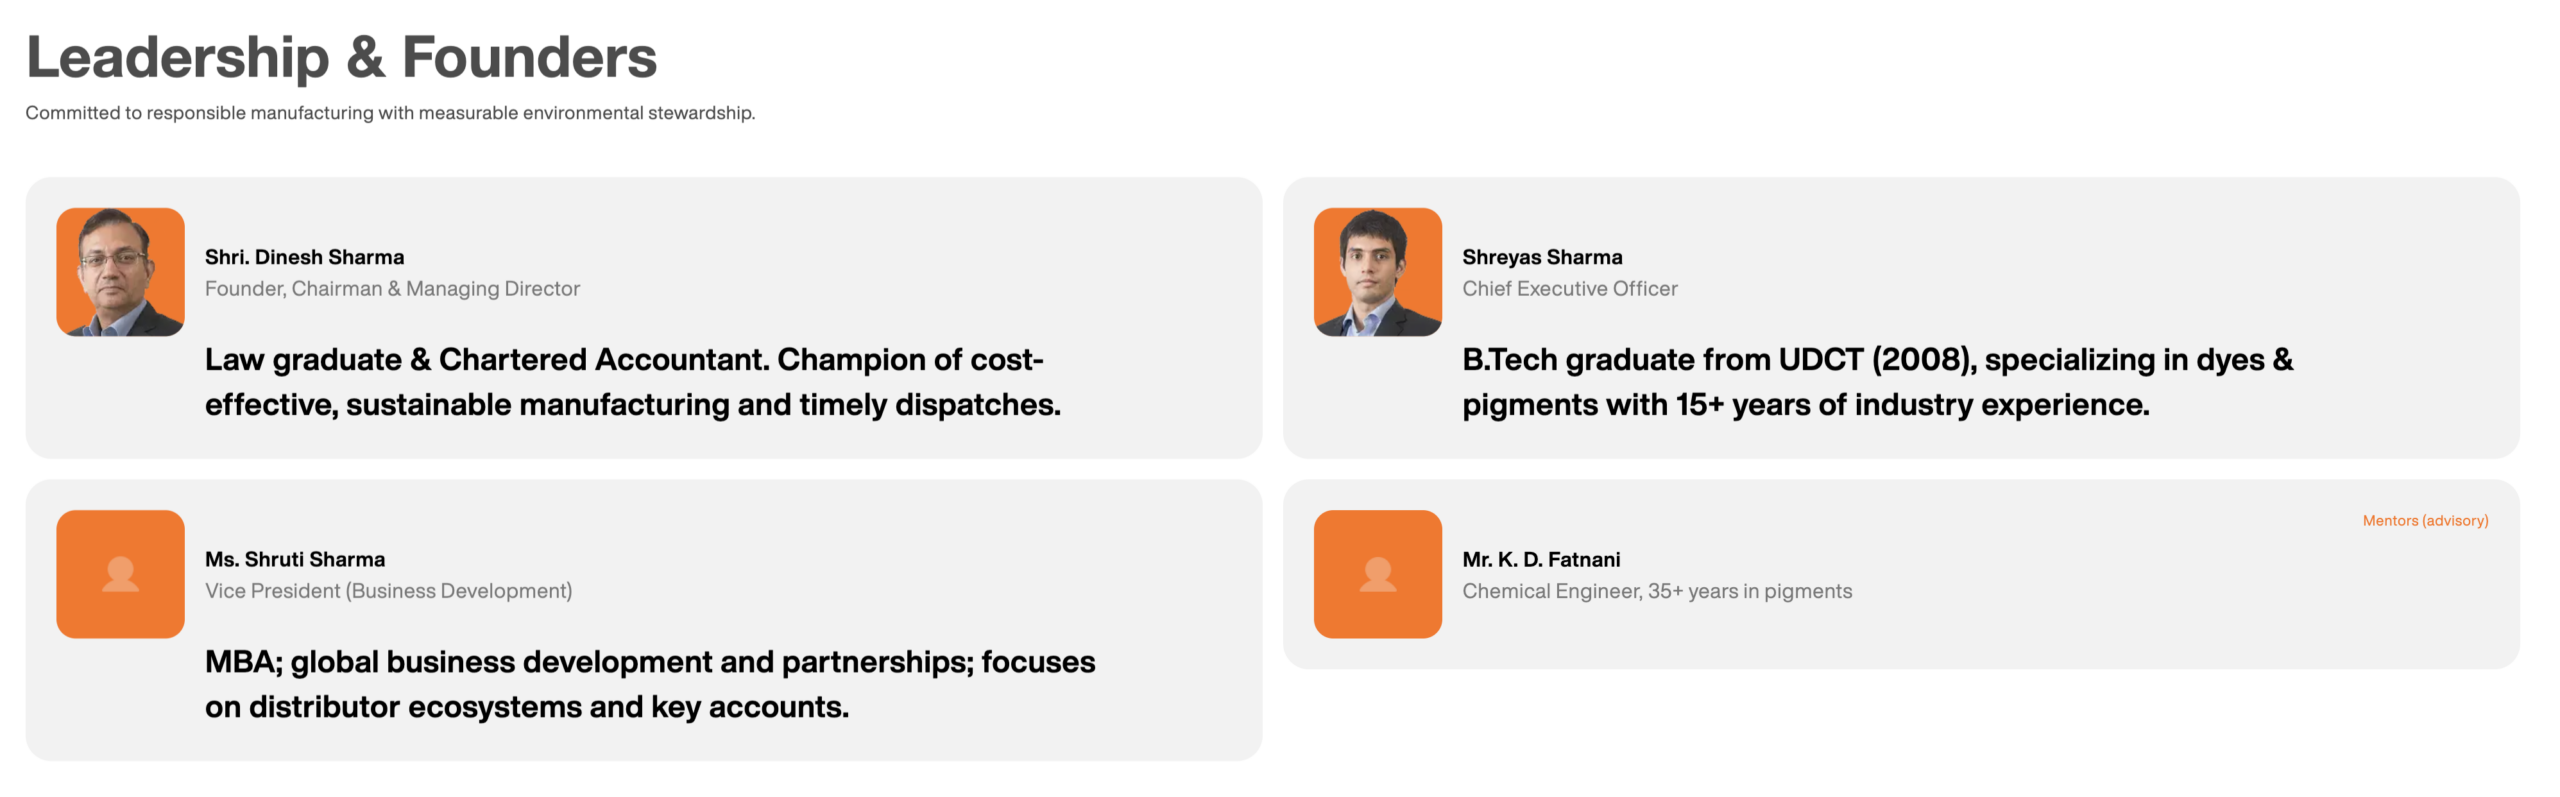
The company is run by Dinesh Sharma (Chairman, a Chartered Accountant and law graduate) and his son Shreyas Sharma (CEO, a UDCT dyes-and-pigments graduate appointed in April 2025). Within the promoter block, Dinesh Sharma HUF holds 30.41%, Shruti Sharma 18.10% and Shreyas Sharma 14.72%. Institutional interest is essentially nil — FIIs at zero and DIIs at 0.15% — so this is a promoter-and-retail story with no fund following it.
Promoter holding eased from 63.85% to 63.23% back in FY25. The June 2026 warrant conversion, in which the two promoters together took 1.5 crore fresh shares, points the other way. Notably, promoters converted their warrants and paid up; a slice of other holders let 52 lakh warrants lapse and forfeited their money — different levels of conviction, priced in cash.
13. Corporate Governance: Angels or Devils?
The FY26 standalone results carry an unmodified audit opinion from A Sachdev & Co, and the CFO’s declaration confirms it. Pledged promoter shares stand at zero. On the visible record, the housekeeping is clean.
Two items belong on the page as facts. First, the related-party lease: Kesar leases its 1,500 MT/month CPC Blue capacity from Shreyas Intermediates, a promoter-linked entity, on a lease the CEO said has run more than twelve years — meaning a chunk of the headline capacity is rented from the family, not owned. Second, the screener flags that the company “might be capitalizing the interest cost,” consistent with the years-long CWIP that only just landed on the fixed-asset line. And despite reporting profits every year since FY21, the company has never declared a dividend — management said one is “in the works” for “next year.” The record so far is profits retained, promises pending.
14. Industry Roast & Macro Context
Indian pigments is a business where, in management’s own framing, the crude end earns 1–2% and reliability plus colour accuracy decide who keeps a customer. It is standardised chemistry sold on price and consistency, with organised and unorganised players both crowding the low end — the rating agency lists domestic competition as a structural weakness. Blue and green pigments account for roughly 80% of the Indian market, so everyone is fighting over the same shades.
The export tilt adds a second exposure: when US tariff noise made a chunk of American demand uncertain, that displaced volume — management estimated the US market at around 2,000 tonnes of pigment — sloshed around the rest of the world and dragged pricing everywhere. Add copper, which the CEO now calls a bigger input than crude oil and “quite volatile,” and you have a sector where the raw material, the buyer’s geography, and the tariff regime can all move against you in the same quarter. Which is more or less what December through March demonstrated.
15. EduInvesting Verdict
| Strengths | Weaknesses |
|---|---|
| Mix shift lifting operating profit ₹2cr → ₹21cr (FY24–FY26) | Q4FY26 loss of ₹5.06cr wiped out the 9M gains |
| Clean books: no pledge, unmodified audit, D/E 0.48 | ROE 6.6% / ROCE 7.4%, below peer set |
| Rating upgraded to IVR BBB/Stable | Never paid a dividend despite years of profit |
| Opportunities | Threats |
|---|---|
| Co-products (fertiliser, zinc phosphate) as margin layer | Tariff and copper-price volatility on an export book |
| Newly capitalised plant yet to run a full year | Related-party leased capacity; capitalised interest flag |
The nine-month numbers and the fourth quarter tell two different stories about the same year, and FY26’s flat full-year profit is where they cancel out. The plant is finally on the balance sheet, the mix has genuinely improved, and the cash is real — but the year ended on a loss the guidance didn’t see coming, and a larger share count now stands between that profit and each shareholder. A business that finally started earning its keep, on a share base that just got harder to earn for.