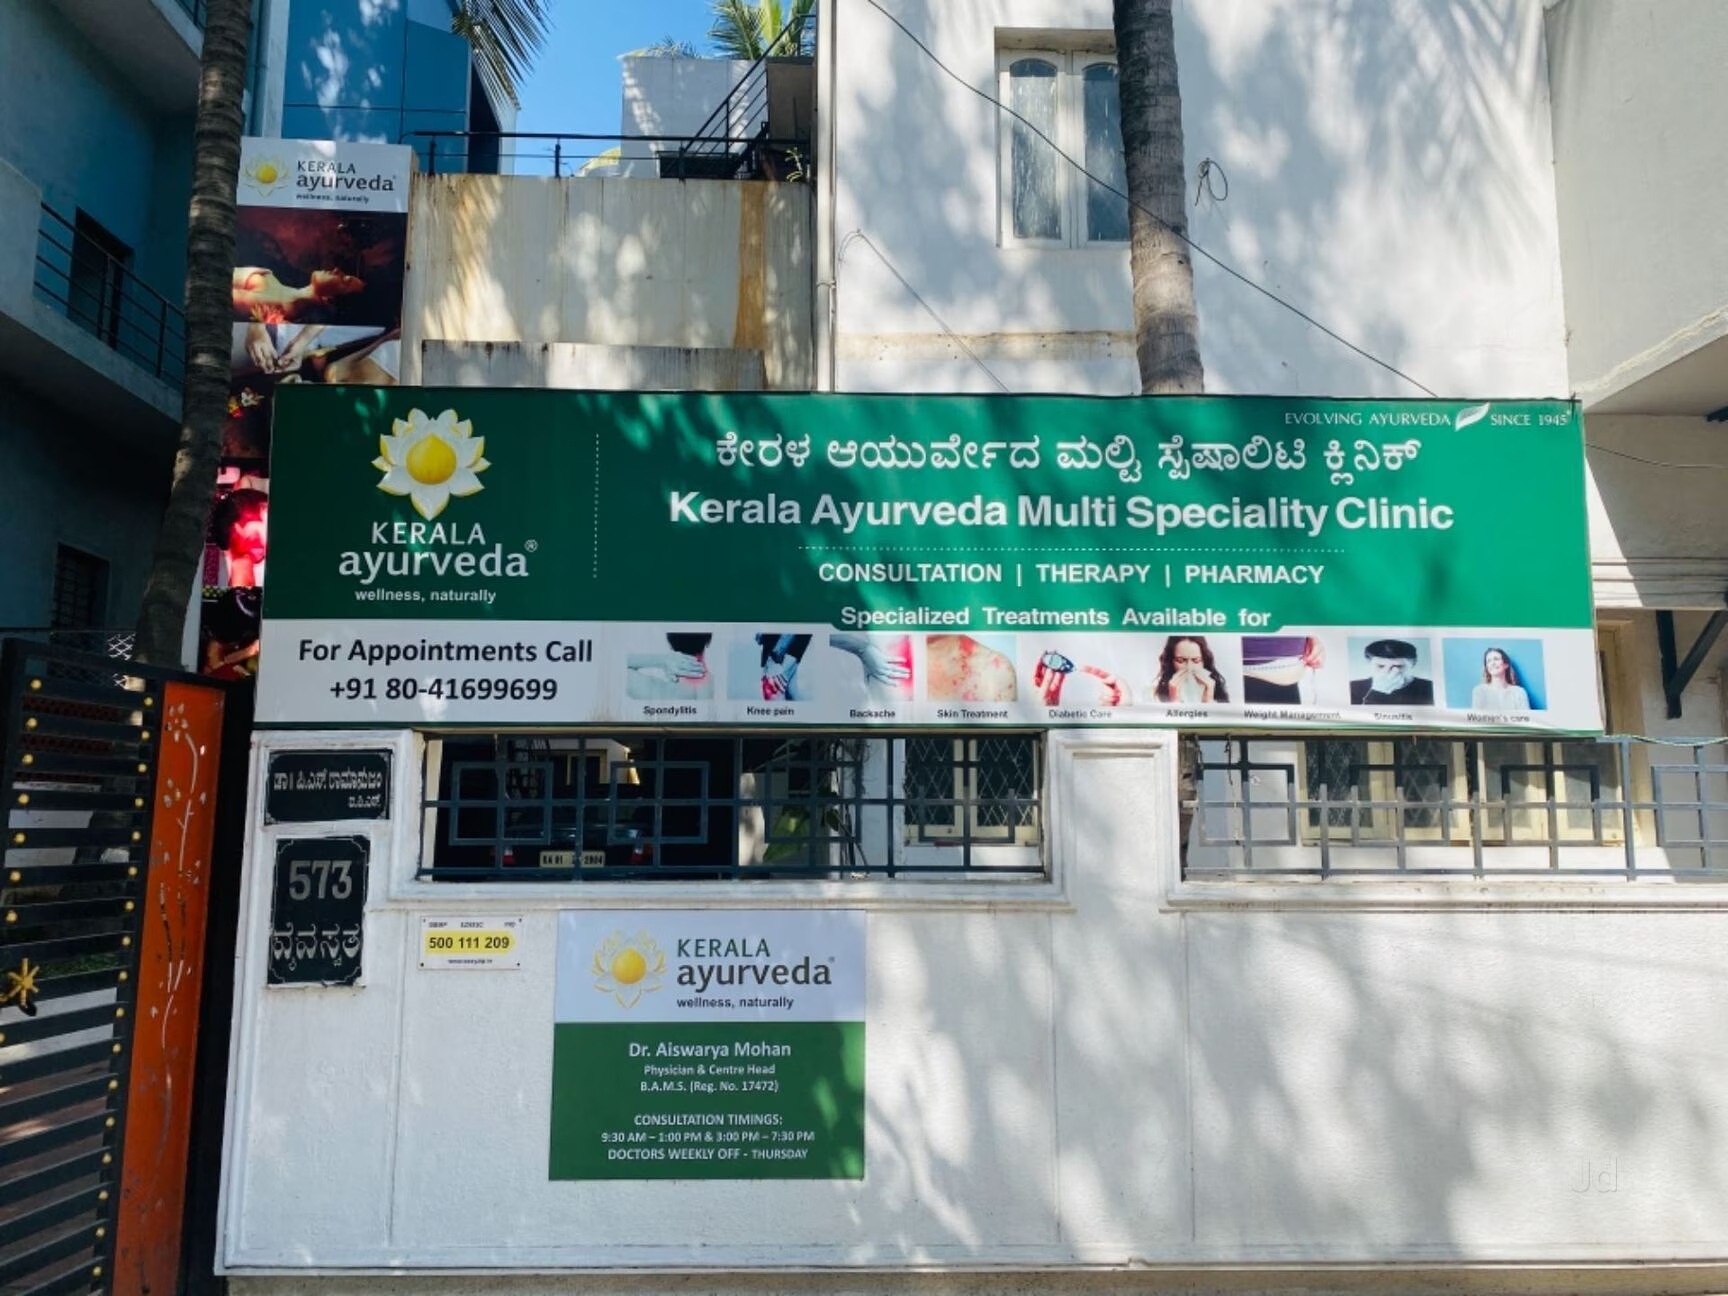
Kerala Ayurveda Q4 FY26: A Loss-Making Wellness Company Burning Cash Faster
Spotted a factual error — a wrong number, date, or fact? Tell us and we will check the source.
General information and entertainment, not investment advice. The author is not a SEBI-registered adviser or research analyst. No recommendation, no promised returns. Markets carry risk including loss of capital. Figures may not be current. Consult a registered adviser before acting.
1. At a Glance
The company reported FY26 consolidated revenue of ₹131 crore—a 4% climb from the prior year. Yet in the same period, net loss widened to ₹16.6 crore from ₹14 crore in FY25. Q4 alone saw a loss of ₹7.76 crore on sales of ₹34.74 crore.
The balance sheet holds ₹86.5 crore in debt against ₹12.7 crore in cash. Return on equity sits at −161%, a warning that the equity base is not just unproductive—it’s actively eroding. Operating margins have collapsed into double-digit negatives.
Management has embarked on acquisitions: taking full control of subsidiary Ayurvedagram, issuing preferential shares to promoters, and converting debt to equity. The aim is to reach ₹200 crore in revenue by FY27. Does any of it work?
2. Introduction
Kerala Ayurveda Limited was founded in 1945 and has spent the last three decades building a sprawl of clinics, resorts, academies, and product manufacturing. The company now operates Ayurveda treatment centers across India and abroad, runs an academy in the US, and maintains a herbarium of 1,200+ medicinal plants.
For much of the 2010s, the company posted low single-digit profits. Then around FY23, the narrative shifted: growth accelerated, but profitability collapsed. From FY24 onwards, the company has reported annual losses. Q4 FY26 was no exception.
On May 25, 2026, the company announced FY26 results. The board also approved fundraising via secured non-convertible debentures of up to ₹40 crore. Two days later came word of fresh officer appointments and the completion of the Ayurvedagram acquisition. By mid-June, the promoter’s stake had fallen from 58.6% to 35.6%, a drop caused by the issuance of preferential shares and equity swaps with Ayurvedagram’s erstwhile shareholders.
3. Business Model: WTF Do They Even Do?
The company operates three main engines: product sales, service delivery, and education.
Product line includes over 350 formulations across diabetes, heart health, joint care, women’s care, and general wellness. These flow via e-commerce, distribution depots (16 as of FY25), and direct-to-consumer channels. The product segment contributed roughly 61% of revenue in FY23, though the company publishes this data spottily.
Services are the real estate grab-bag: treatment centers, wellness clinics, and full-service Ayurvedic resorts. Service revenue (clinics, treatments, consultations) ran around 22% of sales in FY23. Ayurvedagram Heritage Wellness Centre—now fully owned—is the marquee asset. The company acquired a 26% stake in March 2026 via a ₹10 crore share swap and has since moved to 100% ownership.
Education includes the US-based Ayurvedic Academy (with 4,000 alumni as of FY25) and domestic training programs. This arm generated 17% of revenue in FY23 but has been chronically loss-making.
International operations span six US entities and one Singapore subsidiary. The US business alone accounted for 23% of divisional revenue in FY23, yet the entire international apparatus has been a money sink—subsidiaries report large inter-company receivables, many aged beyond six months.
The model is diversified on paper but leaky everywhere. Growth in any one segment is swallowed by losses in another.
4. Financials Overview
Figures are consolidated, in ₹ crore.
Metric
Q4 FY26
Q4 FY25
YoY Change
FY26 Full Year
FY25 Full Year
YoY Change
Revenue
34.74
32.03
+8.5%
131.15
125.6
+4.4%
Operating Profit
-7.1
-10.14
+29.9%
-18.0
-5.2
(worse)
PAT
-7.76
-15.54
improved by 50%
-16.56
-13.96
(worse)
EPS
-5.97
-11.60
+48.5%
-12.74
-11.45
(worse)
Reading the numbers: Year-on-year, Q4’s loss halved—not because the company earned more, but because it spent less and the prior year was worse. Full-year loss expanded; operating margins remained deeply negative at −14.5% in Q4 and −13.7% in FY26.
From the audit report (standalone): The statutory auditors flagged material trade receivables due from subsidiaries, many outstanding over six months, with no provision for expected credit loss recorded. Management’s assertion is that these are “fully recoverable.” The auditor issued an unmodified opinion anyway, meaning the lack of a reserve did not breach auditing standards.
Concall comment: No recent transcripts are available. The May 25 board meeting approved internal and cost auditor appointments but left no guidance on operations.
5. Market Expectations & Historical Multiples
This section describes how the market is currently pricing the company and how that compares with its own history and peer group. It is descriptive, not predictive.
Metric
Current
Historical Average (5Y)
Peer Median
P/E
—
—
32.3
EV/EBITDA
(negative)
(negative)
—
P/B
22.9
—
—
ROE
−161%
−85.2% (3Y avg)
—
ROCE
−9.77%
—
—
The market pays ₹22.9 times book value despite the company reporting a loss and negative return on equity. Peer Pharma companies trade at a median P/E of 32.3x earnings. This company has no earnings to speak of, so the conventional multiple is not