1. At a Glance
Kellton Tech is doing everything — digital transformation, ERP, AI, cloud, maybe even your Zoom background — except one thing: paying dividends. With Q1 FY26 revenue up 12.8% YoY, PAT of ₹22.65 Cr, and a shiny new AI platform announcement, Kellton is flexing growth while keeping its P/E under 15. But don’t let the ₹25 stock price fool you — there’s drama under the hood.
2. Introduction
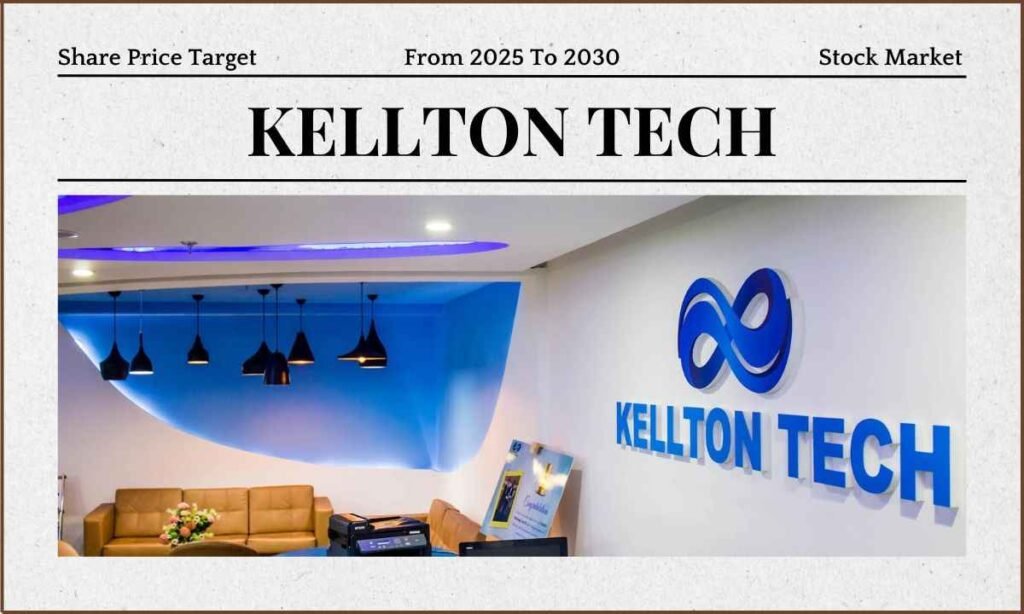
Once upon a tech boom, Kellton was the IT whisperer that nobody whispered about. Quietly growing under the radar, the company built a ₹1,223 Cr market cap and a loyal user base across India, the US, and Europe — while reporting steady profits and skipping dividends like it’s a cardio workout.
Now, with ~1,800 employees and quarterly sales approaching ₹300 Cr, Kellton is finding its AI legs in FY26. A stock split (1:5), FCCBs worth $10M, and three new client wins later — the company is signalling it’s ready for prime time. Or at least a rerun.
3. Business Model (WTF Do They Even Do?)
Kellton is your friendly neighbourhood IT services firm — but instead of Spider-Man, they’ve got cloud engineers and ERP consultants. They offer:
- Agile development
- Digital integration & modernization
- Enterprise mobility
- Testing & automation
- Cloud, AI, ML, Blockchain (aka tech buzzword soup)
Think of them as the IT version of a Swiss Army knife… if half the blades were under maintenance but still sharp enough to land Fortune 500 contracts. Their global presence? India, US, Europe, Asia-Pacific. Their superpower? Building platforms, integrating systems, and not mailing dividend cheques.
4. Financials Overview
Q1 FY26 Report Card:
- Revenue: ₹295.47 Cr (+12.8% YoY)
- PAT: ₹22.65 Cr (+13.6% YoY)
- TTM Revenue: ₹1,131 Cr
- TTM PAT: ₹82 Cr
- Latest EPS: ₹0.46 → Annualized ~₹1.84
- Recalculated P/E: ₹25.1 / ₹1.84 ≈ 13.6x
Margins? Holding steady. OPM
back to 12% after post-Covid fluctuations. And yet, sales growth over 5 years is a modest 7.3% CAGR — clearly, someone took “slow and steady” way too literally.
5. Valuation (Fair Value RANGE only)
| Method | Calculation | Fair Value (₹) |
|---|---|---|
| P/E Method | EPS ₹1.84 × 15–20 | ₹27.6–₹36.8 |
| EV/EBITDA | EBITDA ₹131 Cr × 10–12 = EV ₹1,310–1,572 Cr → per share | ₹26–₹31 |
| DCF (Assume 12% discount, 8% growth) | Equity value est. ~₹1,300–1,500 Cr | ₹26–₹30 |
Fair Value Range: ₹26–₹36
“This FV range is for educational purposes only and is not investment advice.”
6. What’s Cooking – News, Triggers, Drama
- Q1FY26 results: Revenue ₹295 Cr, PAT ₹22.65 Cr
- Stock split: 1:5 completed
- FCCBs: $10M issued, fresh cash = growth juice
- New AI platformlaunched – not just consulting anymore
- Promoter holding droppedfrom 52% to 40% in 1 year 🧐
- Three new clientsadded in Q1FY26 = signs of biz dev life
Is this the beginning of Kellton 2.0? Or a growth story sponsored by FCCB coupons and press releases?
7. Balance Sheet – The Auditor’s Playground
| Metric | FY25 (₹ Cr) |
|---|---|
| Total Assets | ₹789 |
| Equity Capital | ₹49 |
| Reserves | ₹487 |
| Borrowings | ₹163 |
| Net Worth | ₹536 |
🧾D/E ratio ~0.3 — not concerning yet, but the increase


