Kataria Industries Ltd H1 FY26 – ₹170 Cr Revenue, ₹4.37 Cr PAT, Debt Almost Vanished, But Stock Price Acting Like It Didn’t Get the Memo
1. At a Glance – Steel Wires, Windmills & a Confused Stock Price
Kataria Industries Ltd is that rare SME stock which checks many “good boy” boxes on paper but still gets ignored at the market’s birthday party. Market cap sitting around ₹194 crore, current price hovering near ₹90, down roughly 10% in three months and a painful ~22% in six months, while the business quietly keeps supplying wires to bridges, metros, reactors, LNG tanks, and basically every infrastructure project where concrete needs emotional support. Latest half-year (H1 FY26, Sep 2025) revenue came in at ₹170.15 crore with PAT of ₹4.37 crore, yet the stock trades at a P/E of ~19, which is cheaper than most capital goods peers who behave like they invented electricity. Debt is almost extinct at ₹3 crore, ROCE is a respectable ~13.4%, promoter holding is a chunky 75%, and the company even owns a windmill (because why not generate power while bending steel). Despite all this, the market price is sulking like a teenager whose phone got confiscated. Curious already? You should be.
2. Introduction – From Ingot Melting to SME Listing Drama
Kataria Industries was incorporated back in 2004, long before SME IPOs became the new Instagram reel trend. The company started as a manufacturer and supplier of ferrous and non-ferrous ingots and slowly evolved into a full-fledged industrial products player dealing in wires, conductors, PT systems, HDPE ducts, couplers, and accessories. In simple terms, Kataria makes the boring but critical stuff that keeps bridges standing and transmission lines from sagging like investor confidence in bear markets.
Fast forward to July 2024, the company finally knocked on Dalal Street’s door with an IPO of ~56.8 lakh shares, raising about ₹54.57 crore. Since then, it has expanded capacity, acquired Ratlam Wires’ wire division for ₹306 million (₹30.6 crore), and reduced debt aggressively. On paper, this looks like a textbook SME growth story. On screen, the stock chart looks like it missed that memo entirely.
Is this a classic case of “fundamentals doing leg day while price skips gym”? Or is the market sniffing something that retail hasn’t noticed yet? Let’s dig deeper, forensic-auditor-meets-stand-up-comic style.
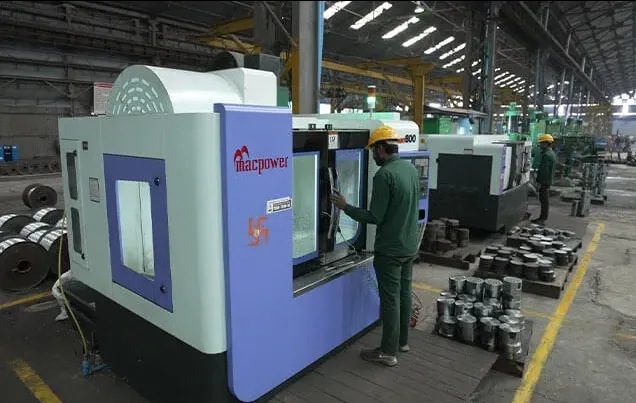
3. Business Model – WTF Do They Even Do?
Kataria Industries operates across multiple industrial verticals, but the heart of the business is wires and conductors. These aren’t the wires you use to charge your phone; these are heavy-duty LRPC stranded wires, conductors, PT anchorage systems, and HDPE ducts used in infrastructure, power transmission, railways, metros, bridges, flyovers, and even atomic reactors. Yes, nuclear plants trust Kataria’s metal more than some investors trust mutual funds.
Installed capacities are serious business: Wires at 45,000 MT, bearing plates 31,500 MT, wedges at a mind-bending 5.25 lakh MT, HDPE duct pipes at 6.75 lakh MT, and conductor division at 6,750 MT. That’s not “we’ll try this segment” scale; that’s “we’re here, deal with it” scale.
Revenue mix shows manufacturing dominance. In FY24, ~95% came from manufactured goods, with trading and scrap playing side characters. Product-wise, HR sheets contributed a whopping ~72% of sales, while LRPC wires and accessories made up most of the remaining pie. Segment-wise, wires contribute ~77%, cables/conductors ~19%, and accessories ~4%.
The business is cyclical, commodity-linked, margin-thin, and volume-driven. In short, Kataria doesn’t sell dreams; it sells tonnes.
4. Financials Overview – Half-Yearly Numbers, Full-Time Drama
Result Type Lock
The latest official heading clearly states “Half Yearly Results”. So this is HALF-YEARLY RESULTS, and EPS annualisation is done by multiplying latest EPS by 2. Lock applied. No cheating later.