General information and entertainment, not investment advice. The author is not a SEBI-registered adviser or research analyst. No recommendation, no promised returns. Markets carry risk including loss of capital. Figures may not be current. Consult a registered adviser before acting.
1. At a Glance
FY26 was the year Kalyani Forge posted its highest profit in roughly fourteen years — ₹9.32 crore PAT — and the year its own auditor declined to give an opinion on the numbers for the third consecutive time. Both of these are true, and they sit in the same set of audited results.
Revenue landed at ₹234.64 crore, essentially flat against the prior year’s ₹236.64 crore. Yet operating profit climbed to ₹28 crore from ₹24 crore, and the Q4 net margin crossed 10% for the first time. The market currently pays about 23x earnings for the company, against an industry P/E of 26.9.
Underneath the profit record, three things moved in the wrong direction: borrowings rose to ₹105.62 crore from ₹71.57 crore a year earlier, the credit rating outlook was revised to Negative, and debtor days stretched to 160. A company can improve its margins and its balance sheet strain in the same twelve months — this year, this one did.
The record profit is the headline. The disclaimer of opinion is the asterisk. This entry covers both.
2. Introduction
Kalyani Forge Limited was incorporated in 1979 and manufactures hot, warm, and cold-forged products from plants in Pune, Maharashtra. It carries the Kalyani name — founded by Dr. Neelkanth Kalyani — and is today run by Viraj Kalyani as Managing Director, with Rohini Kalyani as Executive Chairperson. The board he sits on approved his continued stewardship of a company that makes engine, driveline, and axle components for the automotive and industrial world.
FY26 was, by the company’s own framing, a reset year. Management pruned roughly ₹40 crore of what it called “non-fit” low-margin business, deliberately shrinking parts of the top line to lift the quality of what remained. The result was a rare combination: revenue that barely moved while operating profit expanded.
The year also carried a heavy churn of finance chiefs. CFO Nilesh Bandale resigned in November 2025; Jagdish Baheti was appointed in February 2026 and then resigned effective April 30, 2026, citing personal reasons. The company secretary also stepped down in February 2026. The forge kept running; the finance corner office kept changing occupants.
Three major order wins closed in Q4 — an OEM wheel hub program worth roughly ₹20 crore annually, plus wins with SKF and Schaeffler — all set to ramp from Q1 FY27. Separately, an EV high-volume axle win of about ₹20 crore annual revenue was booked. The forward book is being rebuilt around what management calls “good-fit” customers.
3. Business Model: WTF Do They Even Do?
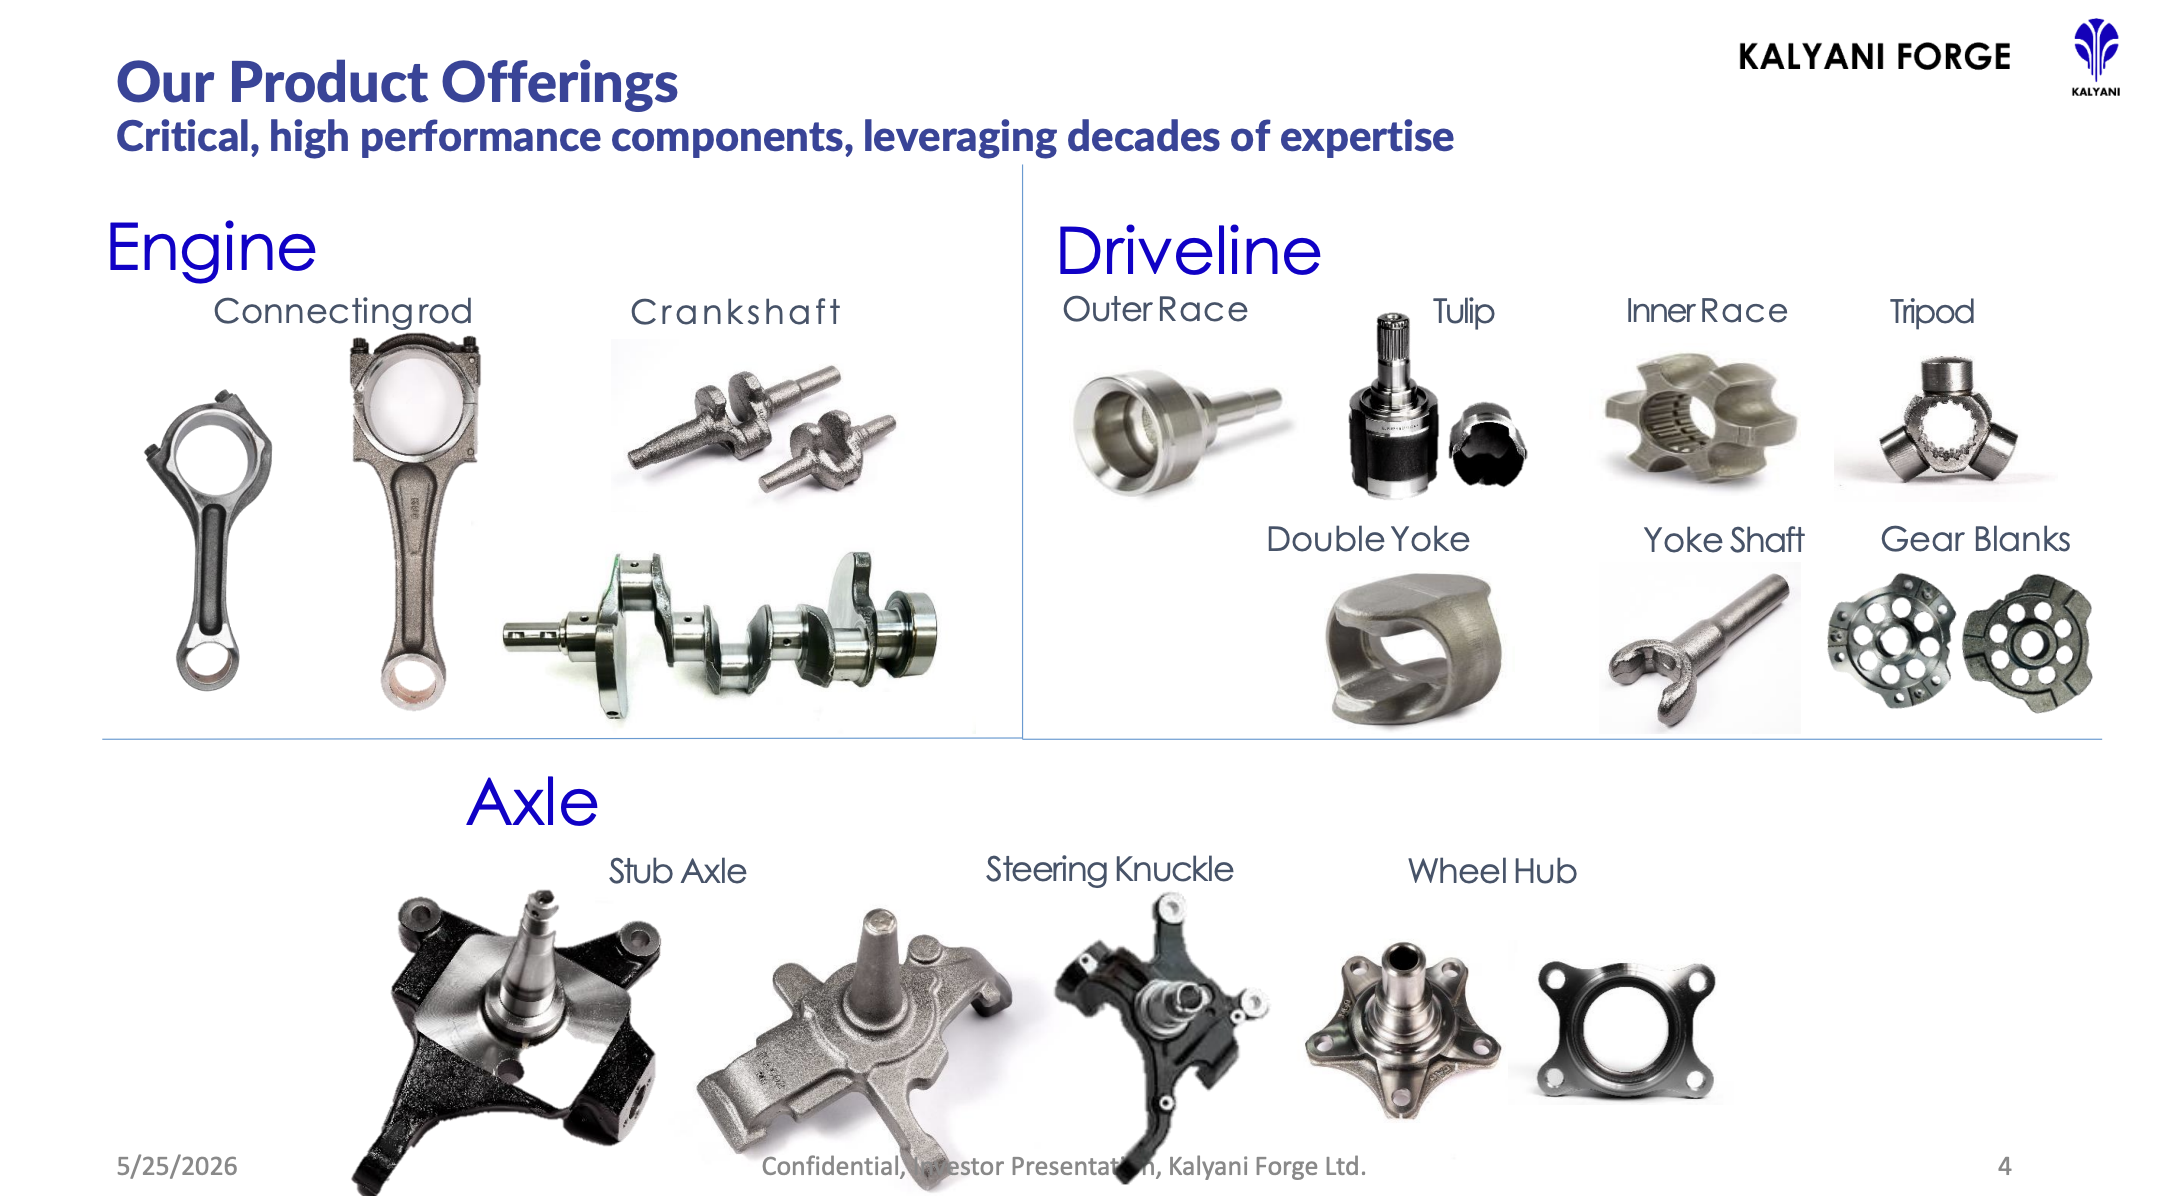
Kalyani Forge takes metal, heats it (or doesn’t), and hits it very precisely until it becomes a part that a truck, tractor, or car cannot run without. The trick they advertise is breadth: hot forging, warm forging, and cold forging under one roof, plus machining, heat treatment, die manufacturing, and testing. Management’s proudest claim is that it is the only forging company offering engine, driveline, and axle components together to OEMs — a “share of wallet” pitch built on decades of combined hot-and-warm forging capability.
The revenue mix tells the strategy. Engine components — connecting rods, crankshafts, gear blanks — make up about 57% of sales, concentrated in heavy commercial vehicles, off-road, and agro applications. Driveline sits near 18%, axle around 10%, and a shrinking “other” bucket at roughly 15% that management is deliberately tapering.
The customer list reads like an auto-industry roll call: Daimler, JCB, Tata, Honda, Cummins, MAN, Kirloskar. The auto sector contributes 60–70% of revenue, which is either diversification or a very elaborate way of being exposed to one cyclical end-market wearing several hats.
Driveline and axle products get positioned as “fuel agnostic” — applicable to electric vehicles, and therefore “future-proof.” It’s a sensible hedge for a forging company: whatever powers the vehicle, something still has to transmit torque to the wheels, and that something gets forged.
Does a “fuel-agnostic” axle business meaningfully insulate a forger from auto cyclicality, or just relabel the same cycle?
4. Financials Overview
Figures are standalone, in ₹ crore. The latest period is Q4 FY26 (quarter ended March 2026).

| Metric | Q4 FY26 | YoY | QoQ |
|---|---|---|---|
| Revenue | 56.98 | −3.3% | −1.5% |
| Operating Profit | 6.73 | +5.8% | −23.2% |
| PAT | 5.88 | +164% | vs −0.12 |
| EPS (₹) | 16.16 | +164% | vs −0.33 |
The PAT jump from ₹2.23 crore to ₹5.88 crore YoY looks explosive, and the quarter-on-quarter swing from a ₹0.12 crore loss to a ₹5.88 crore profit looks even more so. Management flagged the reason directly: deferred-tax timing. Q3 PAT sat near zero, and Q4 saw the reverse effect — management advised reading Q3 and Q4 together for a normalized view rather than treating either quarter’s tax line as the true run-rate.
On the concall (June 2026), management described the margin step-up as structural, anchoring on “15% EBITDA as a floor” and stating a target of 20% within roughly a year. That is management’s aspiration, quoted as such — not a figure that appears in the audited results.
5. Market Expectations & Historical Multiples
This section describes how the market is currently pricing the company and how that compares with its own history and peer group. It is descriptive, not predictive.
| Metric | Current | Peer Median |
|---|---|---|
| P/E | ~23x | 26.9x |
| P/B | 2.29x | — |
| EV/EBITDA | 10.3x | — |
| ROE | 10.1% | — |
| ROCE | 12.2% | — |
The market currently pays about 23x earnings here, against a peer median of 26.9x. What the market appears to be pricing in is the freshly recorded margin expansion — operating profit rising while revenue held flat — balanced against a rating outlook revised to Negative, borrowings that rose to ₹105.62 crore, and a debtor cycle that stretched to 160 days. The multiple sits below the peer set while the balance sheet carries more strain than the peer set typically would.
One factual observation about market expectations: the P/E is being applied to a profit figure that management itself asked observers to normalize across two quarters, given deferred-tax timing.
6. What’s Cooking
Three OEM order wins closed in Q4 FY26 — a wheel hub program of roughly ₹20 crore annual value, plus wins with SKF and Schaeffler — all ramping from Q1 FY27. An EV high-volume axle win worth about ₹20 crore annually was also booked. The board recommended a dividend of ₹4 per share (40% of face value).
On the governance side, the CFO seat changed hands twice inside FY26, with Jagdish Baheti’s resignation effective April 30, 2026. The FY26 secretarial compliance report flagged several non-compliances, with fines including ₹61,360 and ₹5,900. And Crisil revised its rating outlook to Negative from Stable in February 2026, reaffirming the rating at BBB. That is a busy year of filings for a company doing ₹235 crore of revenue.
7. Balance Sheet
Standalone, ₹ crore.
| Item | FY24 | FY25 | FY26 |
|---|---|---|---|
| Total Assets | 204.75 | 230.28 | 251.48 |
| Net Worth | 82.01 | 89.69 | 95.54 |
| Borrowings | 60.91 | 71.57 | 105.62 |
| Other Liabilities | 61.83 | 69.02 | 50.32 |
| Total Liabilities | 204.75 | 230.28 | 251.48 |
Assets equal liabilities in each column — the arithmetic, at least, balances.
- Borrowings rose from ₹60.91 crore to ₹105.62 crore in two years — a ₹44.71 crore increase, roughly a 73% climb, while net worth grew about ₹13.5 crore over the same stretch.
- Receivables swelled to ₹102.65 crore in FY26 from ₹80.82 crore, even as revenue stayed flat — the money is being made on paper faster than it’s arriving in the bank.
- Cash and bank balances stood at ₹2.26 crore against that ₹105.62 crore of borrowings, so this is a net-debt balance sheet, not a net-cash one.
Debt grew to fund growth capex and working capital for scale-up, per the company’s disclosures. When borrowings outrun equity for two straight years, the interest line eventually asks for a word.
8. Cash Flow: Sab Number Game Hai
Standalone, ₹ crore.
| Year | Operating | Investing | Financing |
|---|---|---|---|
| FY24 | 10.00 | −25.85 | 15.73 |
| FY25 | 21.83 | −24.35 | 2.60 |
| FY26 | 7.46 | −33.16 | 24.94 |
FY26 tells a clear story in three columns: operating cash flow of ₹7.46 crore couldn’t cover ₹33.16 crore of investing outflow, so ₹24.94 crore of financing filled the gap. The record profit did not translate into record operating cash — the working-capital stretch (receivables up ₹21.83 crore) absorbed much of what the P&L earned. A profit that lives in receivables is a profit waiting for a bank transfer.
9. Ratios: Sexy or Stressy?
| Ratio | Value |
|---|---|
| ROE | 10.1% |
| ROCE | 12.2% |
| P/E | ~23x |
| PAT Margin | 3.9% |
| D/E | 1.11 |
ROE at 10.1% means the equity base is doing modest, single-digit-plus work — the shareholders’ capital is employed, not straining. ROCE of 12.2% sits above the company’s own multi-year average, where it languished in low single digits and even turned negative in FY20. PAT margin of 3.9% shows how thin forging economics run after depreciation and interest take their cut. D/E at 1.11 is the ratio that moved most this year, and it moved the wrong way as borrowings climbed.
10. P&L Breakdown: Show Me the Money
Standalone, ₹ crore.
| Year | Revenue | Operating Profit | Other Income | PAT | EPS (₹) |
|---|---|---|---|---|---|
| FY24 | 236.79 | 14 | 3.88 | 4.55 | 12.49 |
| FY25 | 236.64 | 24 | 2.51 | 8.31 | 22.82 |
| FY26 | 234.64 | 28 | 3.58 | 9.32 | 25.59 |
The three-year trajectory is the whole thesis in one table: revenue essentially flat across all three years, while operating profit doubled from ₹14 crore to ₹28 crore. This is a margin story, not a growth story — the business earned more from the same sales by pruning low-margin work and squeezing cost.
Other income of ₹3.58 crore sits alongside ₹28 crore of operating profit, so the profit here is overwhelmingly the real forging business, not one-off non-operating gains — a healthier composition than the headline alone shows. PAT and EPS move together across all three years (both rising), so there’s no share-count distortion at the annual level; the share base held at 36.42 lakh shares throughout.
11. Peer Comparison
₹ crore where applicable.
| Company | Sales (Qtr) | PAT (Qtr) | P/E |
|---|---|---|---|
| AIA Engineering | 1,266.27 | 393.33 | 35.17 |
| Happy Forgings | 423.84 | 83.56 | 48.30 |
| Balu Forge | 263.55 | 65.74 | 22.01 |
| Steelcast | 112.43 | 23.18 | 34.99 |
| Nelcast | 368.18 | 15.27 | 26.41 |
| Kalyani Forge | 56.98 | 5.88 | 23.89 |
Kalyani Forge is the smallest name in this set by quarterly sales — several peers do more revenue in a quarter than Kalyani does profit-adjusted in scale. It trades below the peer median P/E of 26.9x. Balu Forge carries a similar multiple on far larger quarterly PAT, while premium names like Happy Forgings and AIA command multiples in the 35–48x band on double-digit margins. The peer set sorts largely by scale and margin, and Kalyani sits at the small-and-strained end of both axes.
12. Miscellaneous: Shareholding & Promoters
| Holder | % |
|---|---|
| Promoters | 58.76 |
| Public | 41.23 |
Promoter holding sits at 58.76%, essentially unchanged across the year, with zero pledging — the family holds through a web of investment companies (Kalyani Consultants, Vakratund, Pax, and others). Within the public block, BF Investment Limited holds 15.66%, and the Investor Education and Protection Fund holds about 3.66%.
The promoters carry four decades of forging experience, per the credit rating. The conduct footnote worth recording: the year’s compliance report logged multiple SEBI non-compliances and fines — the operational family is experienced, and the compliance calendar had gaps.
13. Corporate Governance: Angels or Devils?
This is where the record needs a plain reading. The statutory auditor, M.P. Chitale & Co., issued a disclaimer of opinion on the FY26 results — the third consecutive year of doing so. The stated bases: inventory valuation methodology still being refined and therefore unascertainable; trade receivables, payables, and bank balances subject to confirmation and reconciliation; and internal financial control documentation the auditor could not verify as adequate. Management’s response was that there is “no impact of the qualification” per its best assessment.
The secretarial compliance report added more: entries of unpublished price-sensitive information not updated in the structured digital database, late related-party-transaction filings, and delayed shareholder approval for a director appointment — with fines paid. Internal auditor Nabha Finops and cost auditor RCK & Co. were both re-appointed for FY27.
A disclaimer of opinion three years running is not a red flag someone invented for drama; it is the auditor, in writing, declining to vouch for the numbers.
14. Industry Roast & Macro Context
Forging is a business where you buy steel, add heat and capital-intensive presses, and sell precision — while your customer, the auto OEM, holds most of the pricing power and passes raw-material volatility back to you with a time lag. The auto sector’s cyclicality is the tide every forger floats on, and diversification into industrial, agro, marine, and railway applications is the standard hedge everyone reaches for.
The structural squeeze is real: intense competition from auto-ancillary manufacturers constrains scalability and pricing power, per the credit rating. Working capital runs heavy — inventory and receivables both measured in triple-digit days is normal for the sector, not unique to one name. It’s an industry where the forge is the easy part and the collections calendar is the hard part.
15. EduInvesting Verdict
| Strengths | Weaknesses |
|---|---|
| Operating profit doubled to ₹28 Cr on flat revenue | Auditor disclaimer of opinion, 3rd year running |
| Record ₹9.32 Cr PAT; zero promoter pledge | Borrowings up to ₹105.62 Cr; D/E at 1.11 |
| Opportunities | Threats |
| SKF, Schaeffler, EV axle wins ramping FY27 | Debtor days at 160; rating outlook Negative |
| Fuel-agnostic driveline/axle mix | Auto cyclicality; 60–70% revenue exposure |
FY26 is a study in two ledgers kept side by side: one records the best profit in fourteen years and a genuine margin transformation; the other records borrowings that rose 73% in two years, a receivables book stretching past 160 days, and an auditor who has now declined three times to say the numbers are true and fair.
A company that finally learned to make money on its sales, audited by a firm that won’t put its name to the total.