🧠 1. At a Glance
JSW Steel is India’s second-largest steel producer, backed by the ever-hustling JSW Group. It’s building steel plants like Ambani builds towers — aggressively and with lots of debt. But while volumes are strong, profits are melting faster than a tandoor plate.
PAT down, margins thin, and yet the stock trades at a 65x P/E. What’s going on?
🎬 2. Introduction with Hook
Imagine taking an education loan for Harvard, graduating with a B-grade, and then boasting to the whole world. That’s kind of what JSW Steel is doing.
- Crude steel production up 📈 (Q1 FY26: +14% YoY)
- Profits? Not so much.
- And yet, valuation richer than a boutique TMT stock.
Is JSW Steel overhyped? Or is the market betting on a steel supercycle that hasn’t RSVP’d yet?
🏭 3. WTF Do They Even Do? (Business Model)
JSW Steel manufactures and sells:
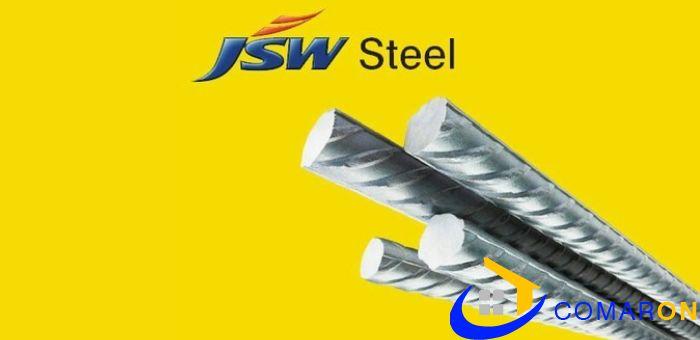
- Hot-rolled coils, sheets, plates
- Cold-rolled and galvanized steel
- TMT bars, wire rods, structural steel
🔩 Main customers: Infra, auto, appliances, pipes, housing.
It’s a vertically integrated beast with capacity in Karnataka, Maharashtra, Odisha, Tamil Nadu and Dolvi.
Also owns mines, does downstream processing, and exports globally.
Oh, and part of JSW Group — which means synergy + diversification + “bhai, paisa de de” style leverage.
📊 4. Financials Overview – Profit, Margins, ROE, Growth
| Metric | FY21 | FY22 | FY23 | FY24 | FY25 |
|---|---|---|---|---|---|
| Sales (₹ Cr) | 79,839 | 1,46,371 | 1,65,960 | 1,75,006 | 1,68,824 |
| Net Profit (₹ Cr) | 7,873 | 20,938 | 4,139 | 8,973 | 3,491 |
| OPM (%) | 25% | 27% | 11% | 16% | 13% |
| ROCE (%) | 16% | 29% | 8% | 13% | 8% |
| ROE (%) | 32.7% | 85.5% | 17.1% | 36% | 14.3% |
⛓️ Margins dropped from 25–27% to 13%
📉 Profit CAGR (3Y): -43%
💀 FY25 PAT collapsed again — back to FY20 levels
💸 5. Valuation – Is It Cheap, Meh, or Crack?
| Metric | Value |
|---|---|
| P/E | 65.6x |
| P/B | 3.19x |
| Market Cap | ₹2.54 Lakh Cr |
| Fair Value Range | ₹680–₹850 (20–25x normalised EPS of ₹34) |
🧮 Even if we use normalized PAT (~₹10,000 Cr), we get an EPS of ~₹33.5.
So 65x actual and 25x normalized = Overvalued steel, premium rust.
🍿 6. What’s Cooking – News, Triggers, Drama
- 🏭 Q1 FY26 crude steel: 7.26 Mnt (YoY +14%)
- ⚙️ QoQ drop due to maintenance shutdown
- 🧮 PAT up 17% QoQ to ₹1,501 Cr, but still way below peak
- 💣 Massive capex + CWIP = ₹21,000 Cr in WIP
- 🧾 Result date: 18 July 2025
Also…
- JSW is pushing for international capacity (UAE, USA)
- Aggressively expanding Dolvi, Odisha plants
- Targeting 35 MTPA+ capacity by FY30
🏦 7. Balance Sheet – How Much Debt, How Many Dreams?
| Metric | FY25 |
|---|---|
| Gross Debt | ₹98,752 Cr |
| Net Worth | ₹79,496 Cr |
| Debt/Equity | ~1.24x |
| CWIP | ₹21,007 Cr |
| Capex Burn | ₹17,000 Cr+ |
🧨 Highly capital intensive, heavy debt, low interest coverage.
In steel, debt can either be your furnace fuel… or your funeral firewood.
💵 8. Cash Flow – Sab Number Game Hai
| Metric | FY24 | FY25 |
|---|---|---|
| CFO (₹ Cr) | ₹12,078 | ₹20,899 |
| Capex Outflow (₹ Cr) | ₹14,467 | ₹17,012 |
| FCF (Rough) | Negative | ~₹3,800 Cr |
They’re generating cash from ops — but it’s being eaten alive by expansion.
No dividends coming your way either. But sure, enjoy the AGM snacks.
📐 9. Ratios – Sexy or Stressy?
| Ratio | FY25 |
|---|---|
| ROCE | 8% |
| ROE | 4.92% |
| OPM | 13% |
| Inventory Days | 142 |
| Payables Days | 132 |
| CCC | 28 |
| Interest Coverage | <3x |
ROCE and ROE crashed post-FY22.
Company has low margin of safety — and heavy commodity exposure.
💰 10. P&L Breakdown – Show Me the Money
| Quarter | Revenue (₹ Cr) | PAT (₹ Cr) | OPM (%) |
|---|---|---|---|
| Q1 FY26 | 44,819 | 1,501 | 14% |
| Q4 FY25 | 41,378 | 719 | 13% |
| Q3 FY25 | 39,684 | 404 | 14% |
| Q2 FY25 | 42,943 | 867 | 13% |
Some bounce-back in profits recently, but nowhere near 2021–22 levels.
⚔️ 11. Peer Comparison – Who Else in the Game?
| Company | P/E | ROCE | OPM | PAT FY25 | Debt/Equity | Notes |
|---|---|---|---|---|---|---|
| JSW Steel | 65.6 | 8% | 13% | ₹3,491 Cr | ~1.2x | Margin squeeze, high capex |
| Tata Steel | 60.1 | 8.8% | 11.5% | ₹3,319 Cr | ~0.8x | Better mix, global biz |
| Jindal Steel | 26.7 | 10.8% | 19% | ₹3,581 Cr | ~0.6x | Most efficient player |
| SAIL | 21.3 | 6.7% | 10.4% | ₹2,599 Cr | ~0.9x | PSU but decent metrics |
| JSW Stainless | 22.5 | 18.2% | 11.8% | ₹2,504 Cr | <0.5x | Dark horse |
JSW Steel is now the most expensive steel stock — and not the most profitable.
🧾 12. Miscellaneous – Shareholding, Promoters
| Category | Jun 2025 |
|---|---|
| Promoters | 44.84% |
| FIIs | 25.78% |
| DIIs | 10.52% |
| Public | 18.16% |
🔍 Promoter stake hasn’t changed
📉 FII holding declined slightly from peak
Retail ownership stable, but still low dividend yield (0.27%)
🧑⚖️ 13. EduInvesting Verdict™
JSW Steel is like an engineering topper who spends everything on protein powder, gym fees, and car EMIs — but can’t crack the final interview.
✅ Volumes up
✅ Capacity ramping
🚫 Profits volatile
🚫 High leverage
🚫 Insane valuation for a cyclical stock
Fair Value Range: ₹680–₹850
(20–25x normalized EPS of ₹34)
For now, the stock is running on hope, hype, and hot metal.
✍️ Written by Prashant | 📅 July 11, 2025
Tags: JSW Steel, Sajjan Jindal, Indian Steel Stocks, Capex Cycle, Ferrous Metals, EduInvesting, Steel Sector Analysis, Debt Heavy Stocks, Commodity Cycles
