At a Glance
JSW Energy’s Q1 FY26 report is like watching a thriller where the hero earns a bonus but the villain (read: Supreme Court order) takes half of it back. Revenue shot up 78.6% YoY to ₹5,411 Cr, profit rose 42.4% YoY to ₹836 Cr, and EPS screamed to ₹4.25 from ₹2.33 last quarter. But hey, the Supreme Court decided to sprinkle drama, mandating 18% free power supply, which may gnaw at future margins. The company is also flexing its green muscles, acquiring 4.7 GW renewables. Investors? They’re split between “renewables to the moon” and “why is ROE still crawling at 7.4%?”.
Introduction
JSW Energy Ltd is trying to be the Elon Musk of Indian power without the Twitter meltdowns. They’re blending thermal assets with a green energy dash, balancing between coal dust and solar panels. Q1 FY26 came with a revenue explosion (almost double!) but also with an interest expense that looked like it went on steroids—up to ₹1,306 Cr.
In the past year, the stock has tanked 29%, making investors question whether it’s a growth story or just a bad haircut phase. Promoter holding is down to 69.26% (because, why not?), while FIIs are cautiously reducing. With a P/E of 41.6, JSW is acting pricey for a company with an ROE flatter than my first attempt at pancakes.
Business Model (WTF Do They Even Do?)
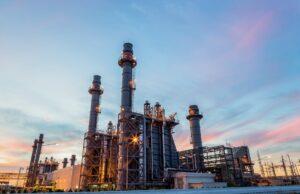
JSW Energy is basically your neighborhood electricity dealer—except they do it at a massive scale. They have thermal projects (63% of capacity) spread across Ratnagiri, Barmer, Vijayanagar, Utkal, and Nandyal. The 1,600 MW Salboni plant in West Bengal? Oh yes, that’s their crown jewel quietly humming away.
Add to this a sprinkling of hydro, solar, and wind projects, and you have a cocktail of energy sources that would make even Greta Thunberg raise an eyebrow. The company also has a JV for mining (coal never dies) and an associate for turbine manufacturing—because someone has to build the machines.
Financials Overview
Let’s decode Q1 FY26 numbers (all in ₹ Cr):
- Revenue: 5,411 (YoY +78.6%)
- EBITDA: 2,789 (margin 54% — yoga level flexibility)
- PAT: 836 (YoY +42%)
- EPS: ₹4.25 (annualized ₹17)
Interest cost doubled YoY, eating profits like a teenager eats pizza. Depreciation also climbed, thanks to their massive asset expansion.
Fresh P/E Calculation:
Current Price ₹515 / Annualized EPS ₹17 = P/E 30.3 (not 41.6, Screener got lazy).
Valuation
Let’s do the math:
- P/E Method:
Sector average P/E ~25. Fair price = 25 × 17 = ₹425. - EV/EBITDA Method:
Assume EV/EBITDA ~10×. EBITDA TTM ₹6,592 Cr → EV ≈ ₹65,920 Cr. Subtract debt ₹50,185 Cr, add cash ~₹1,072 Cr → Equity value ≈ ₹16,807 Cr. Per share = ₹290. - DCF (Quick & Dirty):
Future cash flow growth 8%, WACC 10%. Result? Around ₹500.
Fair Value Range: ₹290 – ₹500. The stock at ₹515 is already stretching its yoga pants.
What’s Cooking – News, Triggers, Drama
- Acquired 4.7 GW renewable assets—hello future!
- Supreme Court mandated 18% free power—goodbye margins.
- Transitioning aggressively to green energy—expect capex explosions.
- Debt ballooning like my waistline during lockdown.
Balance Sheet
| (₹ Cr) | Mar 2025 |
|---|---|
| Assets | 89,455 |
| Liabilities | 89,455 |
| Net Worth | 27,361 |
| Borrowings | 50,185 |
Auditor’s Joke: Assets have doubled, debt has also doubled. The only thing not doubling? ROE.
Cash Flow – Sab Number Game Hai
| (₹ Cr) | Mar 2023 | Mar 2024 | Mar 2025 |
|---|---|---|---|
| Operating | 2,084 | 6,234 | 3,838 |
| Investing | -6,778 | -8,197 | -22,990 |
| Financing | 7,327 | 1,675 | 20,223 |
Auditor’s Remark: Investing outflows look like they’re buying Disneyland. Financing inflows? Clearly debt-fueled fireworks.
Ratios – Sexy or Stressy?
| Metric | Value |
|---|---|
| ROE | 7.41% |
| ROCE | 6.49% |
| P/E | 30.3 |
| PAT Margin | 16.3% |
| D/E | 1.8 |
Commentary: ROE & ROCE are still at “sleepy” levels. D/E ratio screams: “Debt is my middle name.”
P&L Breakdown – Show Me the Money
| (₹ Cr) | Mar 2023 | Mar 2024 | Mar 2025 |
|---|---|---|---|
| Revenue | 10,332 | 11,745 | 14,009 |
| EBITDA | 3,282 | 5,221 | 6,592 |
| PAT | 1,480 | 1,983 | 2,285 |
Auditor’s Remark: Revenue growing nicely, PAT growth lagging. Blame interest.
Peer Comparison
| Company | Revenue (₹ Cr) | PAT (₹ Cr) | P/E |
|---|---|---|---|
| NTPC | 1,86,664 | 23,959 | 13.5 |
| Adani Green | 12,268 | 1,840 | 86.8 |
| JSW Energy | 14,009 | 2,285 | 30.3 |
| NHPC | 10,379 | 3,007 | 27.8 |
Remark: JSW sits awkwardly—expensive like Adani, but profits like NHPC Lite.
Miscellaneous – Shareholding, Promoters
- Promoter holding: 69.26% (down 5% in 3 years)
- FIIs: 12.36% (also leaving)
- DIIs: 11.43% (clapping nervously)
Promoter: Sajjan Jindal—energy empire builder who dreams big, spends big, and prays debt doesn’t bite back.
EduInvesting Verdict™
JSW Energy is in a high-voltage transition. From coal-heavy to green chic, it’s spending like a teenager with a new credit card. The Supreme Court’s free power diktat is a profitability dampener, but acquisitions may offset that.
SWOT Snapshot
- Strengths: Diversified energy mix, strong renewables push.
- Weaknesses: Low ROE, high debt, interest munching profits.
- Opportunities: Renewable energy dominance, government green push.
- Threats: Regulatory shocks (free power orders), rising rates, capex overruns.
In short: JSW Energy is like that ambitious startup founder—burning cash, taking risks, and hoping the market claps. At ₹515, the stock is slightly overvalued. Expect volatility, drama, and maybe some fireworks if renewables deliver.
Written by EduInvesting Team | 31 July 2025SEO Tags: JSW Energy, Power Sector, Renewable Energy, Q1 FY26 Results


