At a Glance
JK Lakshmi Cement just reported a blockbuster Q1 FY26: net profit soared 169% YoY to ₹150 crore, riding on improved margins and volume recovery. Revenue grew 11% YoY to ₹1,741 crore. The stock, however, barely budged at ₹974 – as if Mr. Market was expecting them to build the Burj Khalifa with those numbers. With a ₹3,550 crore capex plan, management clearly wants to expand aggressively. The only red flags? Rising debt, modest ROE (9%), and a P/E of 31x – not cheap, not too expensive.
Introduction
Cement companies love cycles: when demand booms, they print cash; when it slows, they burn it. JK Lakshmi Cement (JKLC) is no exception. Once struggling with muted growth, this quarter’s profit explosion is like watching a cement truck suddenly do a wheelie. Thanks to better realizations, cost control, and steady volumes, they’ve posted their strongest Q1 in years.
But before you load up your portfolio with bags of JKLC, remember: this is a low ROE, high capex, debt-heavy business. One wrong macro turn, and margins can crumble faster than a sandcastle in monsoon.
Business Model (WTF Do They Even Do?)
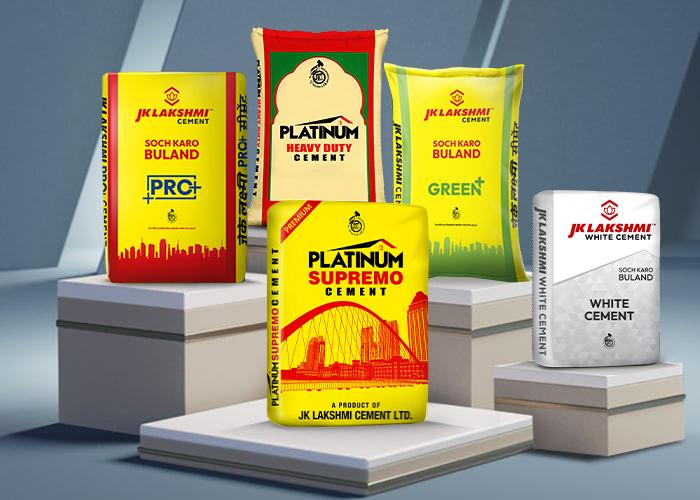
JK Lakshmi Cement is part of the JK Organisation, producing cement, RMC, AAC blocks, and allied products. They operate across North, West, and East India, catering to retail and infrastructure markets. Their competitive edge? Regional dominance in Rajasthan, Gujarat, and Chhattisgarh, plus a growing footprint in Eastern India.
Revenue streams:
- Cement (Core) – 85%
- RMC & AAC Blocks – 10%
- Others – 5%
The business is volume-driven, with profitability tied to power, fuel costs, and pricing power. They’re now doubling down on green energy (renewable power SPV) – because ESG is the new buzzword.
Financials Overview
Q1 FY26 came in hot:
- Revenue: ₹1,741 crore (+11% YoY)
- Operating Profit: ₹311 crore (OPM 18%)
- Net Profit: ₹150 crore (+169% YoY)
- EPS: ₹12.8
For FY25: Revenue ₹6,193 crore, PAT ₹276 crore, EPS ₹23.5.
Commentary: EBITDA margin jumped to 18% (from 7% a year ago), driven by lower input costs. Debt is creeping up, but operating cash remains strong.
Valuation – Fair or Frothy?
Current Price: ₹974
TTM EPS: ₹31.6
P/E Calculation:
- Using TTM EPS → P/E ≈ 30.8
- Using annualized Q1 EPS (₹12.8 × 4 = ₹51.2) → Forward P/E ≈ 19
Fair Value Range:
- P/E Method: EPS ₹40–45, fair P/E 20–22 → FV = ₹800–₹1,000
- EV/EBITDA: FY25 EBITDA ₹943cr, EV/EBITDA ~9x → FV ≈ ₹950
- DCF: Conservative growth 8%, WACC 11% → FV ≈ ₹1,050
🎯 Fair Value Range: ₹900–₹1,050. Stock is fairly valued, with upside tied to capex execution.
What’s Cooking – News, Triggers, Drama
- Q1 PAT up 169% – massive improvement.
- ₹3,550 crore capex to expand capacity – long-term bullish, short-term debt risk.
- Renewable power SPV stake acquisition (26%) ensures cheaper power for 12 years.
- Management shuffle: new senior execs appointed.
- Investor call scheduled: 4 Aug 2025 – expect more capex details.
Balance Sheet (Auditor’s Stand-Up)
| (₹ Cr) | Mar 23 | Mar 24 | Mar 25 |
|---|---|---|---|
| Assets | 6,541 | 7,650 | 8,479 |
| Liabilities | 3,796 | 4,509 | 5,008 |
| Net Worth | 2,804 | 3,187 | 3,471 |
| Borrowings | 1,880 | 2,084 | 2,614 |
Audit Punchline: Assets rising, debt rising faster – like building a skyscraper with borrowed bricks.
Cash Flow – Sab Number Game Hai
| (₹ Cr) | FY23 | FY24 | FY25 |
|---|---|---|---|
| Operating | 634 | 899 | 783 |
| Investing | -299 | -880 | -1,151 |
| Financing | -266 | -36 | 318 |
Stand-Up Audit: Healthy OCF, but investing cash outflow ballooning due to capex. Financing cash inflow signals fresh borrowing.
Ratios – Sexy or Stressy?
| Metric | FY23 | FY24 | FY25 |
|---|---|---|---|
| ROE % | 12 | 15 | 9 |
| ROCE % | 14 | 17 | 10 |
| P/E | 18 | 24 | 31 |
| PAT Margin % | 6 | 7.1 | 4.4 |
| D/E | 0.5 | 0.65 | 0.75 |
Commentary: ROCE dipped, D/E creeping higher – capex risk visible.
P&L Breakdown – Show Me the Money
| (₹ Cr) | FY23 | FY24 | FY25 |
|---|---|---|---|
| Revenue | 6,452 | 6,788 | 6,193 |
| EBITDA | 839 | 1,052 | 864 |
| PAT | 369 | 488 | 276 |
Remark: FY25 was weak, Q1 FY26 shows recovery.
Peer Comparison
| Company | Revenue (₹Cr) | PAT (₹Cr) | P/E |
|---|---|---|---|
| UltraTech | 77,752 | 6,911 | 51.7 |
| Shree Cement | 19,283 | 1,118 | 99.0 |
| ACC | 22,743 | 2,335 | 14.4 |
| JK Lakshmi | 6,370 | 366 | 31.0 |
Commentary: JKLC trades cheaper than UltraTech/Shree but above ACC – mid-tier cement with mid-tier pricing.
Miscellaneous – Shareholding, Promoters
- Promoters: 46.3% (stable)
- FIIs: 12.8% (slightly up)
- DIIs: 25.1%
- Public: 15.7%
Institutions holding steady – a vote of cautious confidence.
EduInvesting Verdict™ (500 Words)
JK Lakshmi Cement’s Q1 FY26 is a solid turnaround story. Profit surge, improved margins, and strategic moves (renewable energy tie-up, expansion capex) signal management’s intent to scale. However, this isn’t a risk-free ride. Capex of ₹3,550 crore means debt will rise, and execution risks loom. The company’s historical growth has been modest (5-year sales CAGR 7%), and ROE remains in single digits.
Strengths:
- Strong Q1 recovery in margins and profit.
- Regional dominance and brand recall.
- Renewable energy integration to cut power costs.
Weaknesses:
- High debt and rising interest costs.
- ROE and ROCE under pressure.
- Sales growth lagging peers.
Opportunities:
- Infrastructure and housing demand boom.
- Capex could boost capacity and earnings long-term.
- Potential for margin expansion with lower fuel costs.
Threats:
- Cement prices cyclical, fuel costs volatile.
- Execution risk on capex projects.
- Rising competition from UltraTech, Ambuja, Dalmia.
Conclusion:
JK Lakshmi Cement is no UltraTech, but it’s also not a penny stock. At ~₹974, it’s fairly valued with potential upside if Q1 momentum continues. For investors, it’s a play on India’s infrastructure story – but with the patience of a cement block curing in the sun. If the ₹3,550 crore capex delivers, this stock could easily hit ₹1,200. If not, you’re looking at dead money for a while.
Written by EduInvesting Team | 01 August 2025
SEO Tags: JK Lakshmi Cement, Q1 FY26 results, cement industry, capacity expansion, infrastructure demand