At a Glance
JBM Auto Ltd – the self-proclaimed leader of India’s electric bus market – delivered Q1 FY26 revenue ₹1,254 Cr (+10% YoY) and PAT ₹39 Cr (+10% YoY). Margins fell to 10% OPM, thanks to rising costs. Stock trades at a dizzy P/E 74x and P/B 11x – that’s Tesla pricing for a bus company!
Introduction
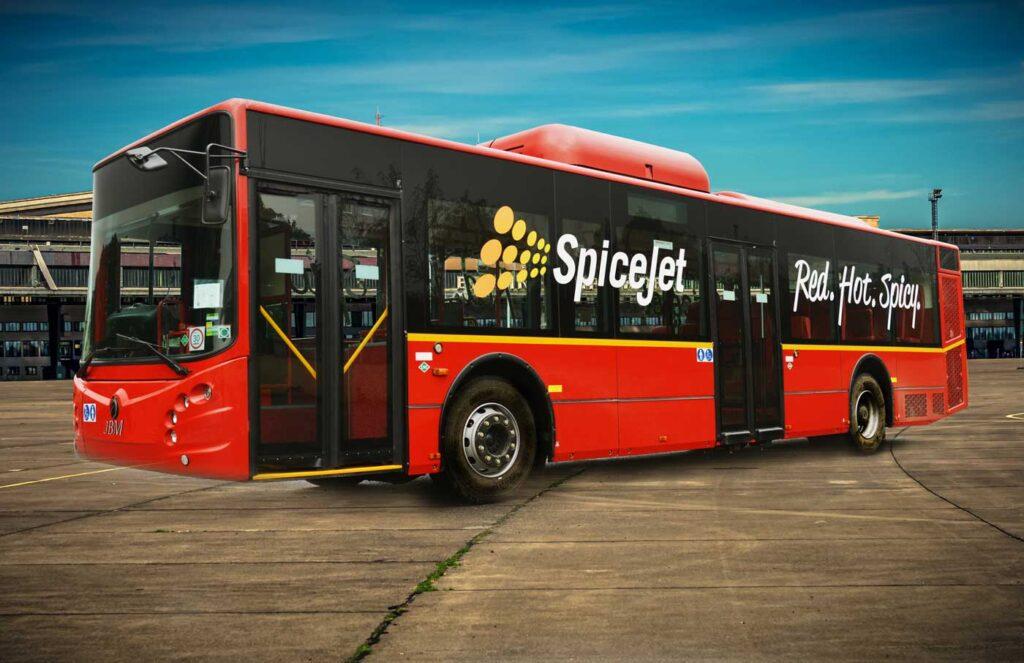
Once a sheet metal supplier, JBM morphed into an EV bus powerhouse, bagging a 30-35% share of the e-bus segment. Sounds futuristic, right? Except the market is now crowded, capex is ballooning, and profits are crawling. The ₹15,208 Cr market cap is betting big on India’s EV revolution. Are you?
Business Model (WTF Do They Even Do?)
- Segments:
- Sheet metal parts for OEMs
- Tooling and dies
- Buses (ICE + EV) + spare parts & AMC
- Revenue Mix: Increasing tilt toward electric buses.
- Edge: Integrated EV ecosystem – from manufacturing to charging.
Roast: Great story, thin margins, and still a supplier-at-heart.
Financials Overview
Q1 FY26
- Revenue: ₹1,254 Cr (+9.6% YoY)
- EBITDA: ₹120 Cr (10% margin)
- PAT: ₹39 Cr (+10% YoY)
- EPS: ₹1.56
FY25 Recap
- Revenue: ₹5,582 Cr
- PAT: ₹220 Cr
- ROE: 16%
- Dividend: 10%
Comment: Growth steady, but valuation insane.
Valuation
- P/E Method
- EPS (TTM): ₹8.7
- Fair P/E: 30x
- Value ≈ ₹260
- EV/EBITDA
- EBITDA: ₹631 Cr
- EV multiple 15x → Value ≈ ₹9,465 Cr → ₹400/share
- DCF:
- Aggressive growth? Maybe ₹500.
🎯 Fair Value Range: ₹400 – ₹500
CMP ₹643 → overvalued.
What’s Cooking – News, Triggers, Drama
- ₹1,500 Cr fundraising approved for future EV expansion.
- New orders expected under FAME-III and state EV policies.
- Risk: High debt, working capital strain, and competition.
Balance Sheet
| (₹ Cr) | Mar 2025 |
|---|---|
| Assets | 5,850 |
| Liabilities | 3,523 |
| Net Worth | 1,351 |
| Borrowings | 2,630 |
Remark: Debt ballooning – watch out.
Cash Flow – Sab Number Game Hai
| (₹ Cr) | FY23 | FY24 | FY25 |
|---|---|---|---|
| Operating | 484 | 205 | 394 |
| Investing | -646 | -443 | -556 |
| Financing | 159 | 248 | 224 |
Remark: Positive ops cash, but capex eats it all.
Ratios – Sexy or Stressy?
| Metric | Value |
|---|---|
| ROE | 16% |
| ROCE | 14% |
| P/E | 74x |
| PAT Margin | 4% |
| D/E | 2.0 |
Remark: High leverage + crazy valuation = risky.
P&L Breakdown – Show Me the Money
| (₹ Cr) | FY23 | FY24 | FY25 |
|---|---|---|---|
| Revenue | 3,857 | 5,009 | 5,582 |
| EBITDA | 398 | 584 | 631 |
| PAT | 125 | 194 | 220 |
Remark: Revenue doubled in 3 years, but profits crawl.
Peer Comparison
| Company | Revenue (₹ Cr) | PAT (₹ Cr) | P/E |
|---|---|---|---|
| Bosch | 18,087 | 2,012 | 58x |
| Uno Minda | 16,774 | 934 | 66x |
| Bharat Forge | 15,123 | 923 | 61x |
| JBM Auto | 5,582 | 220 | 74x |
Remark: JBM trades richer than giants – hype premium.
Miscellaneous – Shareholding, Promoters
- Promoters: 67.5%
- FIIs: 2.3%
- DIIs: 0.09%
- Public: 30%
Observation: Low institutional presence, retail holds the bag.
EduInvesting Verdict™
JBM Auto is a high-beta EV bet – promising but priced like it’s already conquered the EV world. Growth is there, but not enough to justify P/E 74x with debt climbing.
SWOT Quickie
- Strengths: EV bus leader, strong order book.
- Weaknesses: Low margins, high leverage, overvaluation.
- Opportunities: State EV tenders, global expansion.
- Threats: Rising interest costs, competition, policy risks.
Final Word: Great story, risky stock. Suitable for thrill-seekers, not widows and orphans.
Written by EduInvesting Team | 30 July 2025
SEO Tags: JBM Auto Q1 FY26 Results, EV Bus Market Leader, JBM Auto Stock Analysis

