At a Glance
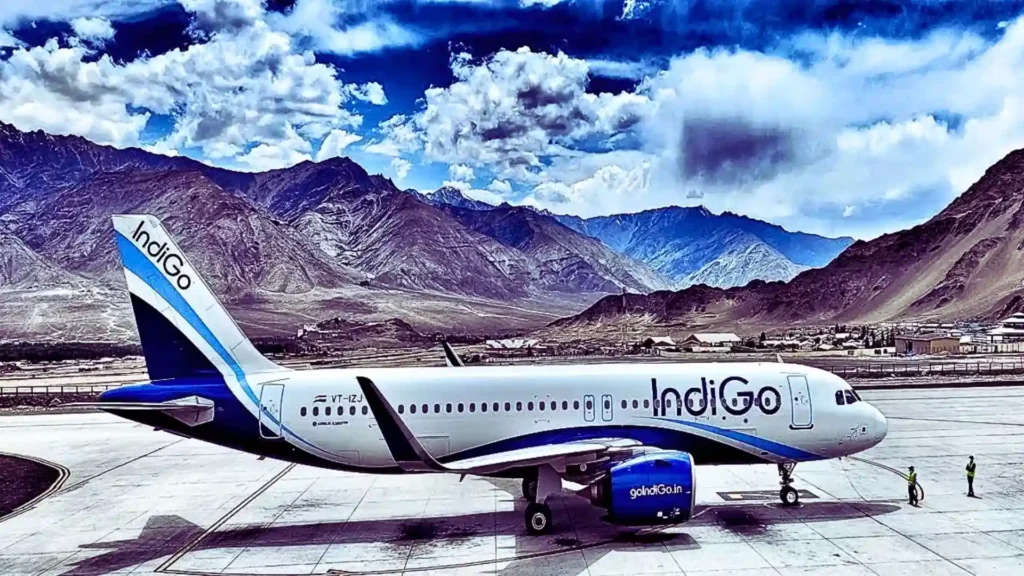
IndiGo’s Q1 FY26 results landed with a profit of ₹2,176 Cr, riding on 12% passenger growth and robust revenue of ₹20,496 Cr. Operating margins at 25% kept the turbines spinning, but QoQ profit fell 30% (turbulence alert). With a market cap ₹2.21 Lakh Cr and a P/E of 33, investors are paying business-class fares for an economy seat. Add falling promoter holding (now 43.5%) and ongoing tax disputes, and the skies may not stay so clear.
Introduction
IndiGo is the airline equivalent of that one overachiever in class: dominating 62% market share domestically and expanding international wings. From one plane in 2006 to 416 aircraft today, it’s a monster in India’s aviation. But the latest quarter shows that even the best flyers hit air pockets. Rising costs, weakening rupee, and aggressive fleet expansion could clip the wings if not managed well.
Business Model (WTF Do They Even Do?)
IndiGo operates as a low-cost carrier (LCC). Translation: they charge you for everything except oxygen. Their magic sauce? Ultra-high aircraft utilisation, bulk aircraft orders (cheap from Airbus), and ruthless cost control. Revenue streams: passenger fares (main), ancillaries (food, baggage, seat selection), and cargo. Risks? Jet fuel (ATF) prices, forex, regulations, and global travel demand.
Financials Overview
Q1 FY26 Snapshot:
- Revenue: ₹20,496 Cr (+5% YoY, -7% QoQ)
- Operating Profit: ₹5,205 Cr (OPM 25%)
- Net Profit: ₹2,161 Cr (-30% QoQ)
- EPS: ₹55.9
Annual FY25 was stellar with revenue ₹80,803 Cr, PAT ₹7,253 Cr, OPM 22%. But the TTM growth slowed to 14% while profit fell -14%.
Valuation
1. P/E Method
- EPS FY25: ₹173
- Industry avg P/E: 25
- Fair Value = 173 × 25 = ₹4,325
2. EV/EBITDA
- EBITDA FY25: ₹18,065 Cr
- Multiple: 8×
- EV ≈ ₹1.44 Lakh Cr → per share ≈ ₹4,500
3. DCF (15% growth, 10% discount)
- Conservative range: ₹4,800 – ₹5,200
Current ₹5,740 → priced for near-perfect execution.
What’s Cooking – News, Triggers, Drama
- Passenger growth 12% keeps top-line strong.
- Fleet expansion to 500+ aircraft planned by FY27.
- International expansion: Middle East, Europe key routes.
- Tax disputes: ongoing cases add legal overhang.
- Promoter exit: Stake down to 43.5% (from 71.9% in 2022) – confidence or cash-out?
Balance Sheet
| Assets (₹ Cr) | Liabilities (₹ Cr) |
|---|---|
| 1,15,914 | 1,15,914 |
| Net Worth | 9,306 |
| Borrowings | 67,088 |
Commentary: Leverage is high (aviation = debt magnet), but cash flows cover interest.
Cash Flow – Sab Number Game Hai
| Year | Ops (₹ Cr) | Invest (₹ Cr) | Finance (₹ Cr) |
|---|---|---|---|
| FY23 | 12,703 | -4,039 | -8,432 |
| FY24 | 21,183 | -11,759 | -9,978 |
| FY25 | 24,065 | -12,782 | -10,975 |
Commentary: Ops cash strong, but investing & financing outflows huge – typical for airlines buying planes like candy.
Ratios – Sexy or Stressy?
| Ratio | Value |
|---|---|
| ROE | 104% |
| ROCE | 17.3% |
| P/E | 33.2 |
| PAT M% | 10.6% |
| D/E | 7.2 |
Commentary: ROE looks godlike, but it’s leverage-driven – risky.
P&L Breakdown – Show Me the Money
| Year | Revenue (₹ Cr) | EBITDA (₹ Cr) | PAT (₹ Cr) |
|---|---|---|---|
| FY23 | 54,446 | 6,521 | -317 |
| FY24 | 68,904 | 16,331 | 8,168 |
| FY25 | 80,803 | 18,050 | 7,253 |
Commentary: FY24 was peak; FY25 profit dipped. FY26 Q1 shows slowdown.
Peer Comparison
| Company | Revenue (₹ Cr) | PAT (₹ Cr) | P/E |
|---|---|---|---|
| Indigo | 81,729 | 6,688 | 33 |
| SpiceJet | 5,284 | 58 | 91 |
| TAAL Ent. | 185 | 49 | 21 |
| Global Vectra | 542 | -0.6 | — |
Commentary: IndiGo dominates but trades at premium valuations.
Miscellaneous – Shareholding, Promoters
- Promoters: 43.54% (falling)
- FIIs: 27.31% (rising)
- DIIs: 24.02% (rising)
- Public: 5.05%
Institutions love it, promoters cashing out – interesting mix.
EduInvesting Verdict™
IndiGo remains India’s aviation king with a fortress market share and best-in-class cost structure. FY26 Q1 profit is strong, but QoQ softness, rising costs, and valuation froth suggest limited upside in the short term.
Past Performance
- From low-cost underdog to global top-7 airline.
- Survived Covid and came back stronger.
Headwinds
- ATF prices, rupee weakness.
- Regulatory taxes, disputes.
- High capex, debt pressure.
SWOT
Strengths: Market leader, strong brand, efficient operations.
Weaknesses: High leverage, low margins vs global peers.
Opportunities: International routes, cargo expansion.
Threats: Oil shocks, competitive fares, legal disputes.
Final Word
IndiGo is still the only Indian airline investors can trust to actually make money. But with promoter exits and a P/E of 33, the stock is already cruising at 35,000 ft. Any turbulence – oil prices, demand slowdown – could send it into a holding pattern. For now, it’s a blue-chip flyer but not a bargain ticket.
Written by EduInvesting Team | 30 July 2025SEO Tags: IndiGo, InterGlobe Aviation, Q1 FY26 Results, Airline Stock Analysis


