General information and entertainment, not investment advice. The author is not a SEBI-registered adviser or research analyst. No recommendation, no promised returns. Markets carry risk including loss of capital. Figures may not be current. Consult a registered adviser before acting.
1. At a Glance
Inox Wind shipped ₹1,244 Cr in Q4 FY26 revenue—essentially flat year-on-year—while full-year sales landed at ₹4,397 Cr, up 24% from FY25’s ₹3,557 Cr. Net profit fell sharply: Q4 PAT collapsed 50% to ₹91 Cr, but full-year PAT recovered to ₹405 Cr, turning modest breakeven into profit after years of losses.
The order book stands at 3.1 GW, providing 24+ months of revenue visibility. Management executed a strategic pivot: the mix shifted from 100% turnkey EPC projects two years ago to 75% equipment supply now. This swap trades EPC’s fat margins for working capital relief—a bet that lower receivable days will matter more than margin points.
The balance sheet weathered a ₹1,250 Cr rights issue in August 2025 and debt has compressed; net cash stands at ₹583 Cr (debt minus cash). Yet working capital—debtor days at 353, inventory at 268 days—remains stretched at 443 days cash conversion, despite a 15-day quarterly improvement.
The tension: Revenue is surging, margins held firm, but the company is fighting a working capital crisis inherited from EPC-heavy execution. The pivot buys time; execution will show whether the tradeoff was worth it.
2. Introduction
Inox Wind started from rubble. From FY23’s ₹733 Cr revenue and ₹709 Cr loss, the company limped forward for two years—narrowly positive in FY24 (₹-48 Cr PAT) and then recovered with ₹448 Cr profit in FY25. The FY26 result (₹405 Cr PAT, ₹1,244 Cr quarterly sales) shows the recovery holding, but profit growth flattened—a 11.8% year-over-year earnings decline despite 24% revenue growth signals margin compression and higher finance costs from working capital borrowing.
Management attributed Q4’s softer profit to imported ECS (Electrical Control System) supply delays tied to geopolitical shipping disruptions, plus sticky receivables from PSU customers holding back on milestone payments. The 1.5 GW CESC order (largest single contract in Indian wind history, awarded Feb 2024) continues execution; it is a mix of turnkey and equipment supply—exactly the hybrid model management wants to exit toward.
In 2025, the group completed a transformative rights issue (₹1,250 Cr net new equity), deployed ₹560 Cr to redeem preference shares, and cemented Inox Green (O&M arm) as a scale platform via 6.5 GW of asset acquisitions. The parent company—freshly merged with Inox Wind Energy Limited—now holds consolidated assets of ₹12,068 Cr versus ₹8,792 Cr a year ago.
3. Business Model: WTF Do They Even Do?
Inox Wind manufactures wind turbine generators (WTGs) in two size classes: 2 MW and 3 MW (3.3 MW variant), with a 4.X MW platform launch scheduled for CY26. The company is fully integrated: it makes nacelles, hubs, and blades in-house across four plants in Gujarat, Madhya Pradesh, and Himachal Pradesh.
The revenue recipe has three slices. Manufacturing & equipment supply: the company ships WTG components to IPPs, PSUs (NTPC, NLC), and commercial-and-industrial players (Aditya Birla, Jakson, Amplus, continuum). EPC (Engineering, Procurement, Commissioning): historically the company handled full project turnkey—land, transmission evacuation, site prep, erection, grid tie. O&M (Operations & Maintenance): subsidiary Inox Green now manages 13+ GW of renewable assets (wind + solar) under 5–20 year contracts, earning steady recurring fees.
The business operates in a dual-currency world. Steel, aluminium, and composite blade materials are procured globally. Overseas suppliers demand long lead times (hence 268-day inventory) and impose pricing discipline; when commodity spikes hit (steel in 2021–22), margin squeezes follow. Domestic erection and commissioning tie cash to customer milestones: supply, erection, commissioning, grid connectivity. Delays at any milestone stack up receivables.
The company’s moat is half-built. Common evacuation infrastructure (substations, transmission corridors) that Inox Green and EPC arm Inox Renewable Solutions own across Gujarat, Rajasthan, and Madhya Pradesh gives the parent an edge on site selection and cost. New capacity (1.2 GW nacelle/hub plant opened Dec 2025, new transformer shop) provides backward integration. But the wind OEM sector is crowded: Suzlon, Vestas, and GE Vernova all operate in India, though only Inox designs for low wind-speed Indian sites.
The group strategy—”ONE INTEGRATED”—leans on captive demand. Parent Inox Clean (the renewable IPP arm) targets 14 GW by FY29, with 20–30% wind component. That’s 2.8–4.2 GW of internal wind orders per year through FY29. Such recurring demand smooths factory utilization and, management hopes, improves working capital via group-company payment discipline.
4. Financials Overview
Figures are consolidated, in ₹ crore.
| Metric | Q4 FY26 | Q4 FY25 | YoY | FY26 | FY25 | YoY |
|---|---|---|---|---|---|---|
| Revenue | 1,244 | 1,275 | -2% | 4,397 | 3,557 | 24% |
| EBITDA | 200 | 282 | -29% | 891 | 757 | 18% |
| PAT | 91 | 135 | -33% | 405 | 438 | -7% |
| EPS | 0.53 | 0.71 | -25% | 2.34 | 2.86 | -18% |
The full-year story differs from the quarter. FY26 revenue sailed past FY25 (24% growth), but PAT dropped 7% despite higher EBITDA, signaling a sharp tax provision jump (₹210 Cr vs FY25’s ₹102 Cr) and elevated finance costs (₹200 Cr vs ₹169 Cr). Deferred tax asset drawdown contributed; management’s cash PAT—PAT plus depreciation plus deferred tax reversion—stood at ₹1,032 Cr (up 28% YoY), painting a healthier cash story than reported earnings.
Q4 detail: The quarter saw ₹1,244 Cr revenue, down 2% YoY despite executing on a massive order book. The reason: Q4 FY25 benefited from Q3/Q4 spurt in 3 MW turbine ramp (new platform transition). Operating margin in Q4 FY26 was 16%, below full-year 20%. Other income (₹61 Cr) included treasury gains and value-added service fees from O&M wing. Interest burden (₹65 Cr) crept higher, reflecting working capital debt for inventory and receivables.
Concall insights: Management guided FY27 revenue growth at 75% (to ~₹7,695 Cr). That assumes full ramping of the CESC 1.5 GW order, plus acceleration in new customer wins. EBITDA margin guidance: 20–22%, implying operating performance stabilizes despite continued input volatility. Management reiterated their pivot: higher equipment-supply share (75%+) reduces EPC margin drag but frees cash and shortens receivable cycles.
5. Market Expectations & Historical Multiples
This section describes how the market is currently pricing the company and how that compares with its own history and peer group. It is descriptive, not predictive.
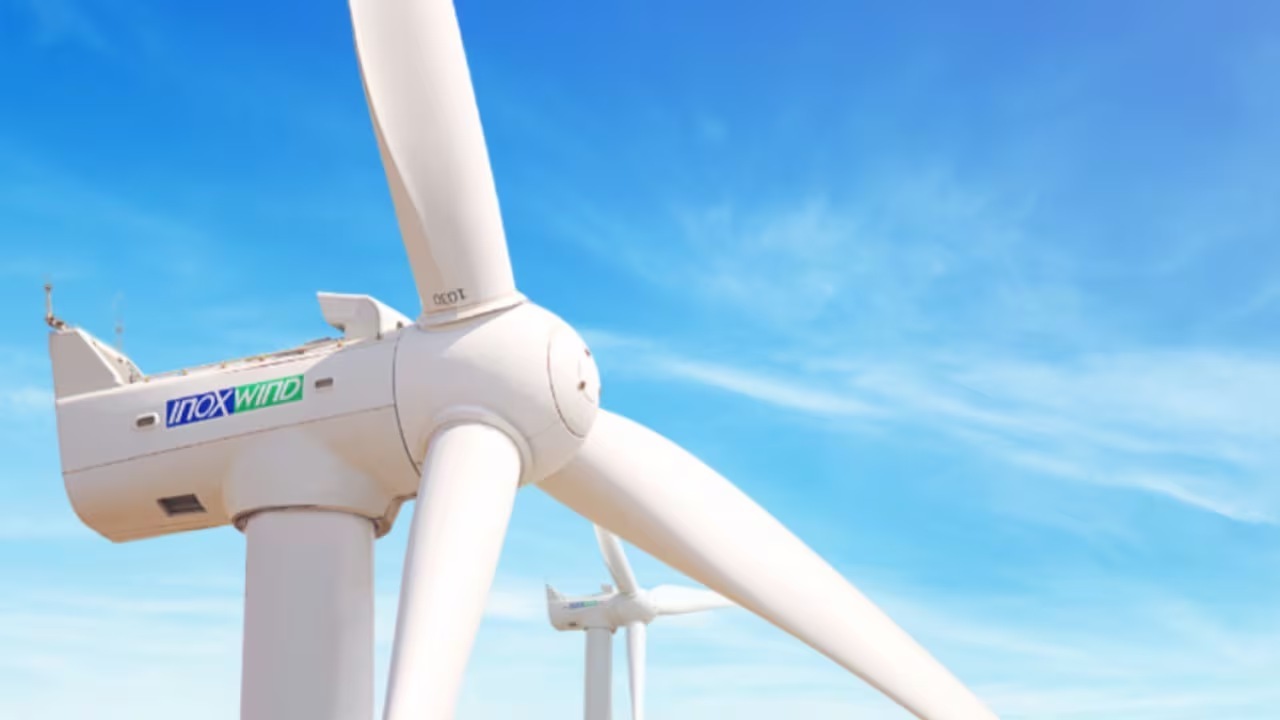
Current Valuation Metrics
| Metric | Current | Historical Avg (5Y) | Peer Median |
|---|---|---|---|
| P/E | 35.0 | 67.1 | 34.0 |
| EV/EBITDA | 14.2 | — | 14.2 (approx.) |
| ROE | 7.1% | -1.9% | 18.6% |
| ROCE | 10.5% | 0.8% | 23.8% |
The market currently pays 35x trailing earnings for Inox Wind, roughly in line with the median of 42 large-cap heavy-equipment peers (Hitachi Energy: 144x; BHEL: 81x; GE Vernova: 95x). But Inox’s 7% ROE sits well below the peer median of 18.6%, and ROCE of 10.5% trails peers at 23.8%.
What the market appears to be pricing in: growth recovery post-losses (FY23–FY25 were brutal), a working capital reset if the equipment-supply pivot works, and group synergies from Inox Clean’s 14 GW platform. The multiple reflects a recovery stock, not a mature wind OEM yet. The company’s five-year historical P/E of 67x is a mirror of its turnaround—years of losses depress the denominator; the current 35x is higher in absolute terms because earnings have returned.
The EV/EBITDA of 14.2x is reasonable for an industrial with 20% operating margins, though the company’s ROCE (10.5%) suggests the market is paying for growth optionality, not today’s capital return.
One closing observation: The company sits inside the peer bandwidth on valuation, but its ROCE gap signals either that working capital efficiency must improve materially, or that today’s price assumes margin expansion and/or CAGR upside beyond the near-term. The 35x P/E depends on the equipment-supply bet paying off.
6. What’s Cooking
CESC 1.5 GW order execution: Largest single contract to an Indian wind OEM. Phased delivery through FY27–FY28; mix of turnkey and equipment supply. Management expects H1 FY27 completion of legacy EPC projects, leaving CESC and selective group demand as primary execution flow.
4.X MW turbine launch: Commercial launch targeted CY26. Design optimized for Indian wind regimes (low wind speed, dispersed sites). Higher power density promises margin uplift vs 3 MW platform and helps offset commodity inflation. Approvals in final stages.
6.5 GW O&M asset acquisition (Inox Green): Two separate deals to consolidate operational wind O&M portfolio. Inox Green will hold 13+ GW under management. Funding via rights issue and group support. Accounting treatment: accruals from 1 Apr 2026 to be consolidated in FY27.
Inox Renewable Solutions demerger/listing: Evacuation infrastructure business hived off (balance-sheet impact: ₹1,000 Cr gross block, ₹50–55 Cr annual depreciation eliminated from Inox Green). IRSL to be automatically listed; timeline: 1–2 months for regulatory clearance and listing.
Inox Clean IPP expansion: Targeting 14 GW by FY29 (current ~2 GW). Implies 3 GW+ annual capacity addition; 20–30% wind means 600 MW–900 MW/year wind demand for Inox Wind, structurally firming order visibility.
PSU receivable delays: Management flagged payment hold-ups from NTPC, NLC on milestone-based contracts. Attributed to macro caution, not credit risk. Equipment-supply pivot expected to improve turnover via letter-of-credit-backed cash collection.
ECS supply chain disruption: Imported Electrical Control System components stuck in ports (geopolitical tensions, shipping congestion). Partial recovery expected Q1–Q2 FY27. Temporary impact on execution pace.
7. Balance Sheet
| Item | FY24 | FY25 | FY26 |
|---|---|---|---|
| Total Assets | 6,754 | 8,792 | 12,068 |
| Total Equity | 3,031 | 5,606 | 7,692 |
| Total Borrowings | 2,078 | 1,500 | 1,587 |
| Other Liabilities | 1,867 | 2,246 | 4,099 |
Assets = Liabilities check: ✓ FY26: ₹12,068 Cr balances.
The balance sheet swelled courtesy the August 2025 rights issue (₹1,250 Cr gross, paid-up capital jumped to ₹1,728 Cr). Equity reserves ballooned from ₹2,417 Cr (FY25) to ₹4,654 Cr (FY26). Debt reduced to ₹1,587 Cr (from ₹1,500 Cr in FY25—a modest re-levering to fund working capital).
The three jarring bullets:
One: Other liabilities spiked ₹1,853 Cr (from ₹2,246 Cr to ₹4,099 Cr). Breakdown: customer advances (milestone-based project payments), payables to TReDS (trade receivable discounting), and deferred income. This is not debt; it reflects the working capital cash-flow timing gap—large advance billing from equipment-supply orders pre-delivery.
Two: Trade receivables hit ₹4,250 Cr (up from ₹2,687 Cr in FY25), a 58% jump despite the equipment-supply pivot. This screams that collection cycles haven’t improved yet; PSU delays and EPC tail-end billing persist. The 353-day debtor cycle is worse than any 5-year peer.
Three: Inventory swelled to ₹1,790 Cr (up from ₹1,351 Cr). This is partly strategic (prepositioned WTG components for Q1 CESC ramp) and partly structural (268-day inventory cycle reflects overseas procurement lead times and component assembly time).
One wisdom line: A balance sheet can be pristine in equity and equity-like liabilities (Inox’s net worth grew 37% to ₹7,692 Cr), yet simultaneously trapped in working capital hell. Net cash of ₹583 Cr masks the real story: cash available for capex or dividends is pinched by the receivables and inventory lock-up.
8. Cash Flow: Sab Number Game Hai
| Year | Operating | Investing | Financing |
|---|---|---|---|
| FY24 | -366 | 487 | -130 |
| FY25 | 138 | -406 | 277 |
| FY26 | -598 | -850 | 1,558 |
FY26’s cash-from-operations turned negative (₹-598 Cr), despite ₹405 Cr net profit. The culprit: working capital swing. Receivables ballooned ₹1,563 Cr YoY, inventory rose ₹438 Cr; these cash outflows overwhelmed profit and depreciation. This is the equipment-supply transition cost—higher revenue, longer collection cycle.
Investing activity burned ₹850 Cr (capex for new plants, CWIP on 4 MW turbine R&D, and investments in subsidiary Inox Green acquisition support). Financing brought in ₹1,558 Cr (the rights issue). The company was NPV-negative on operations but rescued by equity infusion.
The wisdom line: In a capital-intensive, long-cycle manufacturing business, cash flow can diverge wildly from profit. Inox shipped ₹4,397 Cr in FY26 revenue and earned ₹405 Cr profit, yet burned ₹598 Cr operationally. The market’s task is to assess whether FY27’s assumed 75% revenue growth will normalize working capital efficiency or require another cash raise.
9. Ratios: Sexy or Stressy?
| Ratio | Value | Comment |
|---|---|---|
| ROE | 7.1% | Equity is working part-time. Inox earned ₹405 Cr on ₹7,692 Cr net worth—a borrow-rate return. |
| ROCE | 10.5% | Capital employed (debt + equity: ₹9,279 Cr) earned ₹971 Cr EBIT. Turnover is clunky. |
| P/E | 35.0 | Market pays 35x this year’s trailing EPS (₹2.34). Depends on next year’s earnings growth. |
| PAT Margin | 9.2% | Net margin sits healthily above peers (BHEL: 4.7%, Siemens: 9.5%). Operating leverage is there. |
| D/E | 0.21 | Debt is ₹1,587 Cr; equity ₹7,692 Cr. Conservative. Post-rights-issue, very conservative. |
ROE deep-dive: The 7% return on equity is the headline killer. It says shareholder capital is earning below cost of equity (typically 12–15% for a recovering cyclical). The ROCE of 10.5% is similar—just above the WACC floor (often 8–10%), leaving minimal spread. This is typical of turnaround firms: balance-sheet capital is abundant (equity just raised), but earnings haven’t yet scaled to justify that capital base. ROCE expansion to 15%+ would require either operating leverage from scale (FY27’s 75% revenue growth) or margin expansion (4 MW platform, equipment-supply mix).
PAT margin at 9.2% is the counter-signal. BHEL sits at 4.7%; Hitachi Energy at 12.6%. Inox is in the pack, which for a recovering OEM is respectable. Operating leverage is hiding in plain sight: if EBITDA margins hold at 20% and the company can cut interest burden (via working capital efficiency), PAT margin could dip toward 10–11%. That would improve ROE mathematically.
The D/E at 0.21 is fortress-like—net cash position, zero refinancing risk, and balance-sheet room for capex or strategic M&A. This is the one green light.
10. P&L Breakdown: Show Me the Money
| Metric | FY24 | FY25 | FY26 |
|---|---|---|---|
| Revenue | 1,746 | 3,557 | 4,397 |
| EBITDA | 262 | 757 | 891 |
| PAT | -48 | 438 | 405 |
FY26 is a recovery story stumbling on its own success. Revenue grew 24% YoY, EBITDA expanded 18%, yet PAT fell 7%. The gap is taxes (₹210 Cr provision in FY26 vs ₹102 Cr in FY25; the company released deferred tax assets over prior years of losses, so FY26 saw a catch-up). Finance costs also drifted up (₹200 Cr vs ₹169 Cr) due to higher average debt balances from working capital borrowing.
Three-year arc:
- FY24: Recovering from FY23’s ₹712 Cr loss. Executed 376 MW. PAT barely positive at ₹-48 Cr (accounting artifact of tax reversion).
- FY25: Inflection year. 705 MW execution, ₹3,557 Cr revenue (+105% YoY). Operating margin jumped to 21%; PAT hit ₹438 Cr.
- FY26: Growth continued but decelerated. 1,244 MW execution (includes large CESC orders). Revenue up 24%. But execution mix shifted from high-margin turnkey (FY25) to lower-margin equipment supply (FY26). Tax normalization and higher interest pressured PAT.
The business trajectory: not a hockey stick, but a steady ramp with a near-term pause. Management’s FY27 guidance (75% revenue growth, 20–22% EBITDA margin) implies a return to double-digit PAT growth if tax rates and finance costs stabilize. That’s the bullish case. The bearish case is that ECS delays, PSU receivable friction, and equipment-supply margin compression conspire to disappoint FY27 guidance.
11. Peer Comparison
| Company | Revenue | PAT | P/E |
|---|---|---|---|
| Hitachi Energy | 8,148 | 1,028 | 144.2 |
| CG Power & Industrial | 12,418 | 1,230 | 116.2 |
| ABB | 13,093 | 1,523 | 93.6 |
| BHEL | 33,782 | 1,600 | 81.1 |
| Siemens | 24,846 | 2,374 | 53.2 |
| GE Vernova T&D | 6,206 | 1,279 | 94.9 |
| Siemens Energy | 8,735 | 1,348 | 89.4 |
| Inox Wind | 4,397 | 405 | 35.0 |
| Median (42 peers) | 1,703 | 209 | 34.0 |
Inox operates at one-quarter the revenue of the smallest peer (GE Vernova at 6.2K Cr vs Inox at 4.4K Cr). It is a small fish in a large competitive pool. Yet on P/E, Inox sits at 35x, right at the peer median of 34x. That pricing anomaly needs interrogation.
Why does Inox trade at peer P/E despite half the revenue? Growth optionality. The company doubled revenue in FY25 (from 1.7K to 3.5K Cr). FY26 added another 24%. If FY27 delivers 75% growth (to 7.7K Cr), Inox’s CAGR from FY25–FY27 is 48%—vastly outpacing the peer set (which is mature, single-digit to mid-teens growth). The market is thus paying peer multiple on the assumption of above-peer growth.
Margin gap: Inox’s PAT margin is 9.2%; BHEL’s 4.7%; GE Vernova’s 20.6%. Inox sits between, but closer to the bottom. On operating profit (EBITDA), Inox shows 20% margin; Siemens 11%, BHEL 7%. Inox has structural margin edge (design for low wind speed, backward-integrated; allows pricing power). Yet ROCE (10.5%) trails peers by half (23.8% median). The jury: Inox has margin; it hasn’t yet converted that into capital efficiency.
The real comparable: not the heavyweights, but the second-tier offshore-focused wind OEMs (Vestas, GE Renewable Energy) which trade at 20–35x P/E on 5–7% ROCE and mid-20% margins. Inox’s profile—small, high-growth, moderate margins, low ROCE—aligns with that peer set. Trading at the median makes sense if FY27 growth materializes.
12. Miscellaneous: Shareholding & Promoters
| Holder | Stake |
|---|---|
| Promoters | 44.2% |
| Institutions (Foreign) | 14.6% |
| Institutions (Domestic) | 11.0% |
| Public | 30.2% |
Promoter holding collapsed from 72% in Jun 2023 to 44% post-rights issue and NCLT-approved scheme combining Inox Wind Energy Limited with the main company. The main promoter entity now is Inox Leasing and Finance Limited (27.7%) plus Devansh Trademart LLP (8.6%) and Aryavardhan Trading LLP (6.0%)—all Jain-family vehicles. Vivek Kumar Jain holds 1.8% directly.
Promoter roast: The INOXGFL group has infused ₹2,000+ Cr into Inox Wind historically (debt restructuring, equity support, FY25–FY26 rights issue co-bidding). That’s commitment. But the 27.8% promoter stake dilution over 3 years signals that the group is open to external capital and shareholder dilution to fund growth—a sign of either humility (we need money) or pragmatism (let’s get better governance). The Jain family’s other listed entity, Gujarat Fluorochemicals, is a 30+ year stable business; Inox Wind is the growth bet and the group is willing to share upside. That’s a neutral read.
13. Corporate Governance: Angels or Devils?
Auditors: Deloitte Haskins & Sells (statutory); ICRA (internal). Both are Tier-1 firms; no red flags there.
Board: Manoj Dixit (Whole-Time Director, re-appointed Dec 2025 with 94% shareholder support), Devansh Jain (managing direction in group matters), Mukesh Manglik, Sanjeev Jain, Brij Mohan Bansal, Madhurima Sayan Das. Mix of promoter and independent directors.
Pledged equity: 10.4% of promoter holding is pledged to lenders. This is the red flag. It means ₹1.47 Cr shares (of 4.73 Cr total) are mortgaged as collateral. In a market crash or covenant breach, lenders can liquidate and call rights. The company’s leverage improved post-rights issue (D/E now 0.21), but if leverage creeps back and market cap falls, pledge risk rises.
Related-party transactions: Inox Green (61% subsidiary) receives O&M fees from the parent and IPP affiliate. Inox Renewable Solutions (EPC arm, partially divested via IRSL listing) supplies cranes and transformer services to the parent. These are arms-length, but concentration is high; the bulk of execution and cash flow depends on group internals.
Tax demands: None flagged in recent announcements. GST structure (12% → 5% reduction) is government policy, not a litigation vector.
Resignations: Manoj Dixit re-appointed (Dec 2025). No recent departures flagged in regulatory filings. Management continuity appears stable.
NCLT-approved scheme: Merger of Inox Wind Energy Limited with Inox Wind Limited (Apr 2024) was NCLT-approved, clean closure. The recent IRSL demerger (evacuation infra separated from Inox Green) is also court-approved. Governance process intact.
Red flag summary: Pledged equity (10.4%) is the only concrete worry. Rest are structural observations. The company is not scandal-prone, but it is a group-dependent entity with high related-party exposure.
14. Industry Roast & Macro Context
India’s wind sector is booming—6 GW of capacity added in FY26 (highest ever), RTC (Round-the-Clock) and FDRE (Firm and Dispatchable Renewable Energy) tenders now mainstream. The macro is a tailwind: policy (ALMM mandate for 75–80% domestic component sourcing), regulation (CERC hybrid transmission rules), capacity targets (500 GW non-fossil by 2030, 1,800 GW by 2047).
But the sector has three structural headaches:
One: Commodity exposure. Steel, aluminium, and composite fibers are global commodities. Inox’s margins are hostage to input price swings. The 2021–22 spike (steel ₹55–70/kg) crushed OEM margins because projects had locked-in customer pricing. Pass-through is possible on new contracts, but lag risk is acute. FY26 saw steel prices moderate; if they rally again (China stimulus, supply shock), Inox’s 20% EBITDA margin target is in jeopardy.
Two: Distribution and logistics chaos. Wind turbines are oversized, immobile goods. Site access, local content sourcing (blades, towers), and grid evacuation infrastructure are chokepoints. ECS component delays (FY26) and ROW (Right-of-Way) cost inflation are endemic in India’s semi-developed transmission network. The company mitigates this via group-owned evacuation infrastructure, but not all sites have that luxury. Competitors (Vestas, GE) face the same friction, but larger scale gives them bargaining power.
Three: Renewables policy whiplash. India’s renewable energy targets are credible (IMF, World Bank, IEA all cite India’s 500 GW by 2030 commitment as serious). But policy implementation is ad-hoc: wind auction pricing has been volatile (₹2.50–3.50/kWh), subsidy structures shift, and grid evacuation constraints can bottle-neck projects. Hybrid/RTC projects are the next wave (more stable PLF, grid stability value), but project economics are thin if battery costs don’t fall further.
The sector roast: Wind OEMs in India are in a race to scale fast enough to amortize capex before the next policy swing or commodity shock. Inox is executing smartly (pivot to equipment supply, group demand backstop, new platforms). But the wind industry globally is consolidating—Vestas, Siemens Gamesa, and GE Renewable Energy have exited low-margin markets. Inox’s survival depends on its India-specific advantage (low-wind-speed design, backward integration, group synergies). That’s defensible, but not impregnable.
15. EduInvesting Verdict
| **Strengths | Weaknesses** |
|---|---|
| Orders of 3.1 GW provide 24+ months revenue visibility. | Working capital cycle (443 days) is deteriorating, not improving. Receivables jumped 58% YoY. |
| Equipment-supply pivot reduces EPC tail risk and payment delays. | PAT margin compression despite revenue growth signals execution or cost pressure. |
| 4.X MW platform launch (CY26) offers margin uplift and tech refresh. | ROE 7% and ROCE 10.5% are subpar; shareholder capital is not earning its cost. |
| Net cash position (₹583 Cr) and conservative D/E (0.21) provide capex and M&A flexibility. | Group-dependent model (Inox Clean demand, Inox Green O&M, IRSL infra) concentrates risk. |
| Rating upgrade (ACUITE AA-) and ₹1,250 Cr equity infusion signal group and lender confidence. | PSU receivable delays and ECS supply-chain disruptions persist; FY27 guidance depends on resolution. |
| Opportunities | Threats |
|---|---|
| Inox Clean’s 14 GW platform (targeting 2.8–4.2 GW/year wind) creates recurring internal demand through FY29. | Commodity price spikes (steel, composites) could compress margins; pass-through lag is real. |
| Life extension and WTG retrofit services (via Inox Green) open high-margin recurring revenue. | Larger global OEMs (Vestas, GE) could intensify India focus if costs or tariffs shift. |
| Demerger and listing of IRSL provides valuation unlock and operational autonomy for evacuation infra. | Execution delays on CESC 1.5 GW or broader grid constraints could delay revenue realization. |
Closing line: A balance sheet with nothing to hide, an order book with everything to prove, and a working capital cycle that will determine whether the equipment-supply pivot was prescience or stalling tactic.
