1. At a Glance
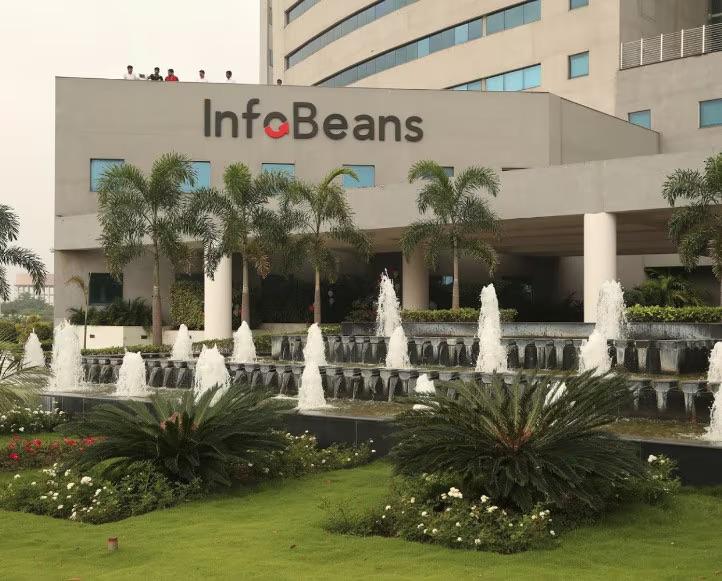
InfoBeans just dropped a beast-mode Q1 — revenue up 23%, PAT up 200%, and EBITDA margin up 89% YoY. Market yawns. Stock trades at just 20x PE. Smallcap tech revival incoming?
2. Introduction with Hook
If you blinked, you probably missed InfoBeans going full beast mode. Like a sleeper agent finally waking up, it delivered a quarter that would make even Persistent Systems sweat.
- PAT YoY: ₹23 Cr vs ₹7 Cr → +200%
- Revenue YoY: ₹112 Cr vs ₹91 Cr → +23%
- EBITDA YoY: ₹23 Cr vs ₹12 Cr → +89%
- Market Cap: ₹1,097 Cr — the smallest serious player in IT now roaring with compound intent.
3. Business Model (WTF Do They Even Do?)
InfoBeans = Boutique Digital Engineering Services Provider
They play in the sweet spot between product companies and IT outsourcing.
- Primary Services:
– Custom software development
– Product engineering
– UX/UI consulting
– DevOps, Cloud, Testing
– AI/ML integration
– Salesforce & ServiceNow services - Industries Served:
– Real Estate
– Healthcare
– SaaS
– Media & Publishing - Recent Addition:
– Green IT Park (via new subsidiary Ecoplex Infra Pvt Ltd)
Think of them as the craft brewery of the IT world — small batches, high precision, consistent quality.
4. Financials Overview
| Metric | Value |
|---|---|
| TTM Revenue | ₹410 Cr |
| TTM PAT | ₹54 Cr |
| EBITDA TTM | ₹76 Cr |
| EPS TTM | ₹21.95 |
| ROE | 12.4% |
| ROCE | 16.8% |
Track Record (CAGR):
- Revenue (5Y): 20%
- Profit (5Y): 13%
- Profit (TTM): +100% 🔥
- EPS FY23: ₹14.83 → FY25: ₹21.95
Profit is finally catching up with top-line — the lag is healing.
5. Valuation
| Metric | Value |
|---|---|
| CMP | ₹449 |
| P/E | 20.2x |
| Book Value | ₹136 |
| P/B | 3.29x |
| Market Cap | ₹1,097 Cr |
Valuation Ranges:
- P/E Method (20x–25x): FV = ₹439 – ₹549
- EV/EBITDA (12x–15x): FV = ₹450 – ₹560
- Growth Adjusted PEG (1x): FV ≈ ₹500
EduInvesting FV Range™: ₹440 to ₹550
CMP = Near lower end. Q1 suggests re-rating may already be underway.
6. What’s Cooking – News, Triggers, Drama
- Q1 FY26 Monster Print → 200% PAT surge
- 6 New Clients added
- Formed new subsidiary: Ecoplex Infra → Green IT park vision
- Margins bounced back to 21% OPM
- Hiring plans + aggressive infra buildup in pipeline
- Investor call scheduled (23 July) = More tea to spill
7. Balance Sheet
| Metric | FY25 (₹ Cr) |
|---|---|
| Equity Capital | 24 |
| Reserves | 308 |
| Borrowings | 20 |
| Total Liabilities | 401 |
| Fixed Assets + CWIP | 129 |
| Investments | 114 |
| Other Assets | 157 |
Key Takeaways:
- Still low leverage
- Asset-heavy due to capex (Infra+Green Park)
- Healthy reserves
- Strategic investments instead of cash hoarding
8. Cash Flow – Sab Number Game Hai
| Year | CFO | CFI | CFF | Net Cash |
|---|---|---|---|---|
| FY23 | ₹77 Cr | ₹-71 Cr | ₹-14 Cr | ₹-8 Cr |
| FY24 | ₹44 Cr | ₹-24 Cr | ₹-15 Cr | ₹4 Cr |
| FY25 | ₹50 Cr | ₹-27 Cr | ₹-13 Cr | ₹10 Cr |
Verdict:
Capex being absorbed well. Free cash flow is positive. No cash starvation despite infra play.
9. Ratios – Sexy or Stressy?
| Ratio | FY25 |
|---|---|
| ROCE | 16.8% |
| ROE | 12.4% |
| OPM | 19% |
| EPS | ₹21.95 |
| D/E | 0.06 |
| Debtor Days | 80 |
| Working Capital Days | 72 |
Commentary:
Solid all-round metrics. Debtor days rising a bit. ROE/ROCE could tick higher with operating leverage kicking in post-Q1 FY26.
10. P&L Breakdown – Show Me the Money
| Year | Revenue | EBITDA | PAT | EPS | OPM |
|---|---|---|---|---|---|
| FY22 | ₹271 Cr | ₹66 Cr | ₹55 Cr | ₹22.75 | 24% |
| FY23 | ₹385 Cr | ₹71 Cr | ₹36 Cr | ₹14.83 | 18% |
| FY24 | ₹369 Cr | ₹51 Cr | ₹22 Cr | ₹9.25 | 14% |
| FY25 | ₹395 Cr | ₹68 Cr | ₹38 Cr | ₹15.58 | 17% |
| TTM | ₹410 Cr | ₹76 Cr | ₹54 Cr | ₹21.95 | 19% |
11. Peer Comparison
| Company | Mkt Cap (Cr) | P/E | ROCE | OPM | EPS | PAT Qtr |
|---|---|---|---|---|---|---|
| Persistent | ₹89,467 | 65.9 | 30.4% | 17.2% | ₹39.5 | ₹396 Cr |
| LTIMindtree | ₹1,53,404 | 32.5 | 27.6% | 16.9% | ₹1254 | ₹1,254 Cr |
| InfoBeans | ₹1,097 | 20.2 | 16.8% | 19.0% | ₹21.95 | ₹23.32 Cr |
Observation:
Not in the same weight class, but margin and RoCE profile comparable. Small size, big bite.
12. Miscellaneous – Shareholding, Promoters
| Holder | % (Jun 2025) |
|---|---|
| Promoter | 74.44% |
| FII | 0.45% |
| DII | 0.00% |
| Public | 25.11% |
| Shareholders Count | 25,012 |
Clean Structure:
- Promoters firmly in control
- FII interest inching up
- No signs of dumping or dilution
13. EduInvesting Verdict™
InfoBeans just dropped a results bomb. Margins are back, PAT exploded, and infra expansion is on. The market’s asleep — but this looks like a classic under-the-radar compounding candidate with real optionality in infra + niche digital services.
EduInvesting Verdict™:
When beans go boom — you best be watching. Smallcap IT is heating up, and InfoBeans may just be writing the cookbook.
Metadata
– Written by EduInvesting Team | July 23, 2025
– Tags: InfoBeans, Smallcap IT, Digital Engineering, SaaS Services, Green Infra


