


At a Glance
Indraprastha Gas Limited (IGL), the gas guy for Delhi-NCR and beyond, just dropped its Q1 FY26 numbers. Net profit came at ₹428 Cr, sliding 11% YoY as margins got squeezed tighter than Delhi’s traffic jams. Revenue stood at ₹3,914 Cr (up 11% YoY), proving people still love their CNG despite EV buzz. ROE at 17% still flexes, and the dividend yield of 2.2% keeps income investors smiling—barely. But with stock price down 27% in a year, Mr. Market is screaming, “Where’s the growth, bro?”
Introduction
Imagine a company with monopoly-like dominance in a gas-hungry market, yet it struggles to impress shareholders. Enter IGL, the joint venture baby of GAIL, BPCL, and Delhi Govt. It sells CNG and PNG like hot samosas to lakhs of households and thousands of industrial clients. But wait, the romance is fading. Rising input costs and competition from EV charging stations are making this love story complicated.
The Q1 FY26 numbers reveal a company trying to balance rising volumes with shrinking margins. Revenue rose, yes, but profit margins look like they’ve been on a diet plan. Add in regulatory caps and the occasional gas pricing drama, and you’ve got an interesting investment puzzle.
Business Model (WTF Do They Even Do?)
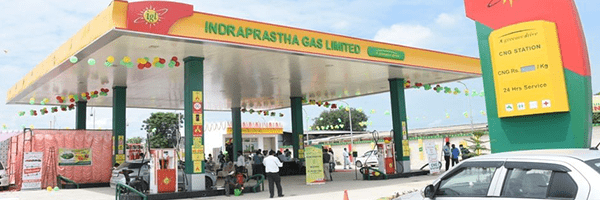
IGL is the king of City Gas Distribution (CGD) in Delhi-NCR. It runs 819 CNG stations and has 25.6 lakh residential PNG connections. It supplies to industrial, commercial, and domestic consumers across multiple cities.
Revenue streams:
- CNG Sales: 70% of revenue (think taxis, autos, buses).
- PNG Domestic & Industrial: 30% (think kitchen stoves to boilers).
The business is simple: buy gas from upstream suppliers like GAIL, distribute it through pipelines, and charge consumers. Sounds great? Sure. But margins depend on government pricing, global LNG prices, and competitive threats (EVs, hydrogen, you name it).
Financials Overview
| Particulars (₹ Cr) | Q1 FY26 | Q1 FY25 | YoY Change |
|---|---|---|---|
| Revenue | 3,914 | 3,517 | +11% |
| EBITDA | 511 | 576 | -11% |
| Net Profit | 428 | 480 | -11% |
| OPM % | 13% | 16% | Down 300bps |
EBITDA margin slid as input costs refused to chill. OPM at 13% is a far cry from the 19–20% glory days. Profit after tax also dropped thanks to higher depreciation and flat other income.
Valuation
Let’s crunch some numbers like an auditor on steroids.
- P/E Method:
- EPS (TTM) ≈ ₹11.9
- Sector P/E ≈ 20x
- Fair Value ≈ 11.9 × 20 = ₹238
- EV/EBITDA Method:
- EV ≈ Market Cap + Debt – Cash = ₹28,430 Cr + 93 Cr – 2,200 Cr ≈ ₹26,323 Cr
- EBITDA (TTM) ≈ ₹1,900 Cr
- EV/EBITDA ≈ 13.8x (Sector Avg 15x)
- Fair Value ≈ ₹225–240
- DCF (Super Simplified):
- FCF ≈ ₹1,200 Cr, growth 5%, WACC 10%
- FV ≈ ₹230
👉 Fair Value Range: ₹225–240. Stock at ₹203 looks undervalued but not screaming BUY.
What’s Cooking – News, Triggers, Drama
- EV Threat: Delhi is pushing electric buses and cars. Will autos ditch CNG?
- New Geographies: Expansion into UP and Rajasthan cities keeps volumes ticking.
- Regulatory Moves: Any price hike or subsidy tweak can swing margins.
- Gas Prices: Falling global LNG prices could boost margins in upcoming quarters.
Balance Sheet
| ₹ Cr (Mar 2025) | Value |
|---|---|
| Assets | 15,581 |
| Liabilities | 5,045 |
| Net Worth | 10,616 |
| Borrowings | 93 |
Auditor’s Roast: Debt-free? Almost. Cash pile fat? Yes. Then why is the stock acting like it owes money to everyone?
Cash Flow – Sab Number Game Hai
| ₹ Cr | Mar 2023 | Mar 2024 | Mar 2025 |
|---|---|---|---|
| Operating | 2,231 | 1,532 | 2,199 |
| Investing | -841 | -1,103 | -1,519 |
| Financing | -1,359 | -316 | -754 |
Roast: Strong operating cash, but investing cash flows look like a shopaholic spree on pipeline expansions.
Ratios – Sexy or Stressy?
| Metric | Value (FY25) |
|---|---|
| ROE | 17% |
| ROCE | 21% |
| P/E | 17x |
| PAT Margin | 13% |
| D/E | 0.01 |
Verdict: Ratios still sexy. D/E ratio almost zero, but PAT margins need some gym time.
P&L Breakdown – Show Me the Money
| ₹ Cr | Mar 2023 | Mar 2024 | Mar 2025 |
|---|---|---|---|
| Revenue | 14,133 | 14,000 | 14,913 |
| EBITDA | 2,044 | 2,388 | 1,958 |
| PAT | 1,640 | 1,983 | 1,713 |
Roast: Revenue growth is okayish, but PAT refuses to grow—like that lazy cousin who never gets a job.
Peer Comparison
| Company | Revenue (₹ Cr) | PAT (₹ Cr) | P/E |
|---|---|---|---|
| Adani Total Gas | 5,233 | 648 | 106x |
| Petronet LNG | 49,447 | 3,709 | 12x |
| Gujarat Gas | 16,487 | 1,148 | 27x |
| Mahanagar Gas | 7,310 | 1,085 | 13x |
| Indraprastha Gas | 15,318 | 1,661 | 17x |
Roast: IGL is stuck between cheap Petronet and overpriced Adani. Not a bad place, but not the king either.
Miscellaneous – Shareholding, Promoters
- Promoters: GAIL & BPCL hold 45% combined.
- Govt of Delhi: 5% stake—political shield, sometimes sword.
- FIIs: 16.8%, DIIs 24%, Public 9%.
Buzz: No IPO drama, but investor meet on July 31 may bring clarity on margins.
EduInvesting Verdict™
IGL is like that reliable friend who always shows up—until they start canceling plans. Strong balance sheet, near-zero debt, decent ROE, and a business that’s not going extinct anytime soon. Yet, growth is slowing, margins are under pressure, and EV adoption is a lurking monster.
SWOT Analysis
- Strengths: Monopoly in NCR, strong cash flows, debt-free.
- Weaknesses: Margin compression, regulatory dependency.
- Opportunities: Expansion to new cities, falling LNG prices.
- Threats: EV disruption, policy changes.
Final Word: At ₹203, the stock isn’t a disaster, but it’s not a rocket either. For long-term investors, this is a “sip chai, hold stock” scenario. For traders, wait for margin recovery cues.
Written by EduInvesting Team | 30 July 2025SEO Tags: Indraprastha Gas Ltd, IGL, City Gas Distribution, Q1 FY26 Results


: Investors Strap In for a Bumpy, Billion-Euro Ride")


