Indogulf Cropsciences Q4 FY26: The Math on Cheap Gets Expensive When the Crop Won’t Grow
Spotted a factual error — a wrong number, date, or fact? Tell us and we will check the source.
General information and entertainment, not investment advice. The author is not a SEBI-registered adviser or research analyst. No recommendation, no promised returns. Markets carry risk including loss of capital. Figures may not be current. Consult a registered adviser before acting.
1. At a Glance
Indogulf posted 19% revenue growth in FY26 to ₹705 crore, but the quarter got squeezed. Net profit climbed 27% for the year—a halo effect from a lighter tax rate and tighter working capital—yet profitability margins compressed in Q4, signalling the perennial stress of an agrochem business: volumes and pricing move in opposite directions.
The company traded at 9.75x trailing earnings (prices referenced as of late June 2026), sitting 60% below its five-year industry average P/E of 23.5x.
Its balance sheet fattened on IPO proceeds: borrowings halved from ₹227 crore to ₹183 crore in a single year, and a ₹76 crore capex build for Barwasni’s expansion plant is underway, gating growth on regulatory approvals.
The tension: strong top-line momentum against margin compression, and plenty of expansion capacity with nothing to fill it yet.
2. Introduction
Indogulf was incorporated in 1993 and listed in July 2025 after raising ₹160 crore in fresh equity. The Aggarwal family, steeped in agrochemicals for over four decades, runs the show: Chairman Om Prakash Aggarwal, MD Sanjay Aggarwal, and a clutch of officers with 20+ years each in manufacturing, operations, and sales.
The company operates four manufacturing units across Nathupur (Haryana—formulations and technical actives), Samba (Jammu & Kashmir—formulations), and Barwasni (Haryana—fertilizers and the expansion site).
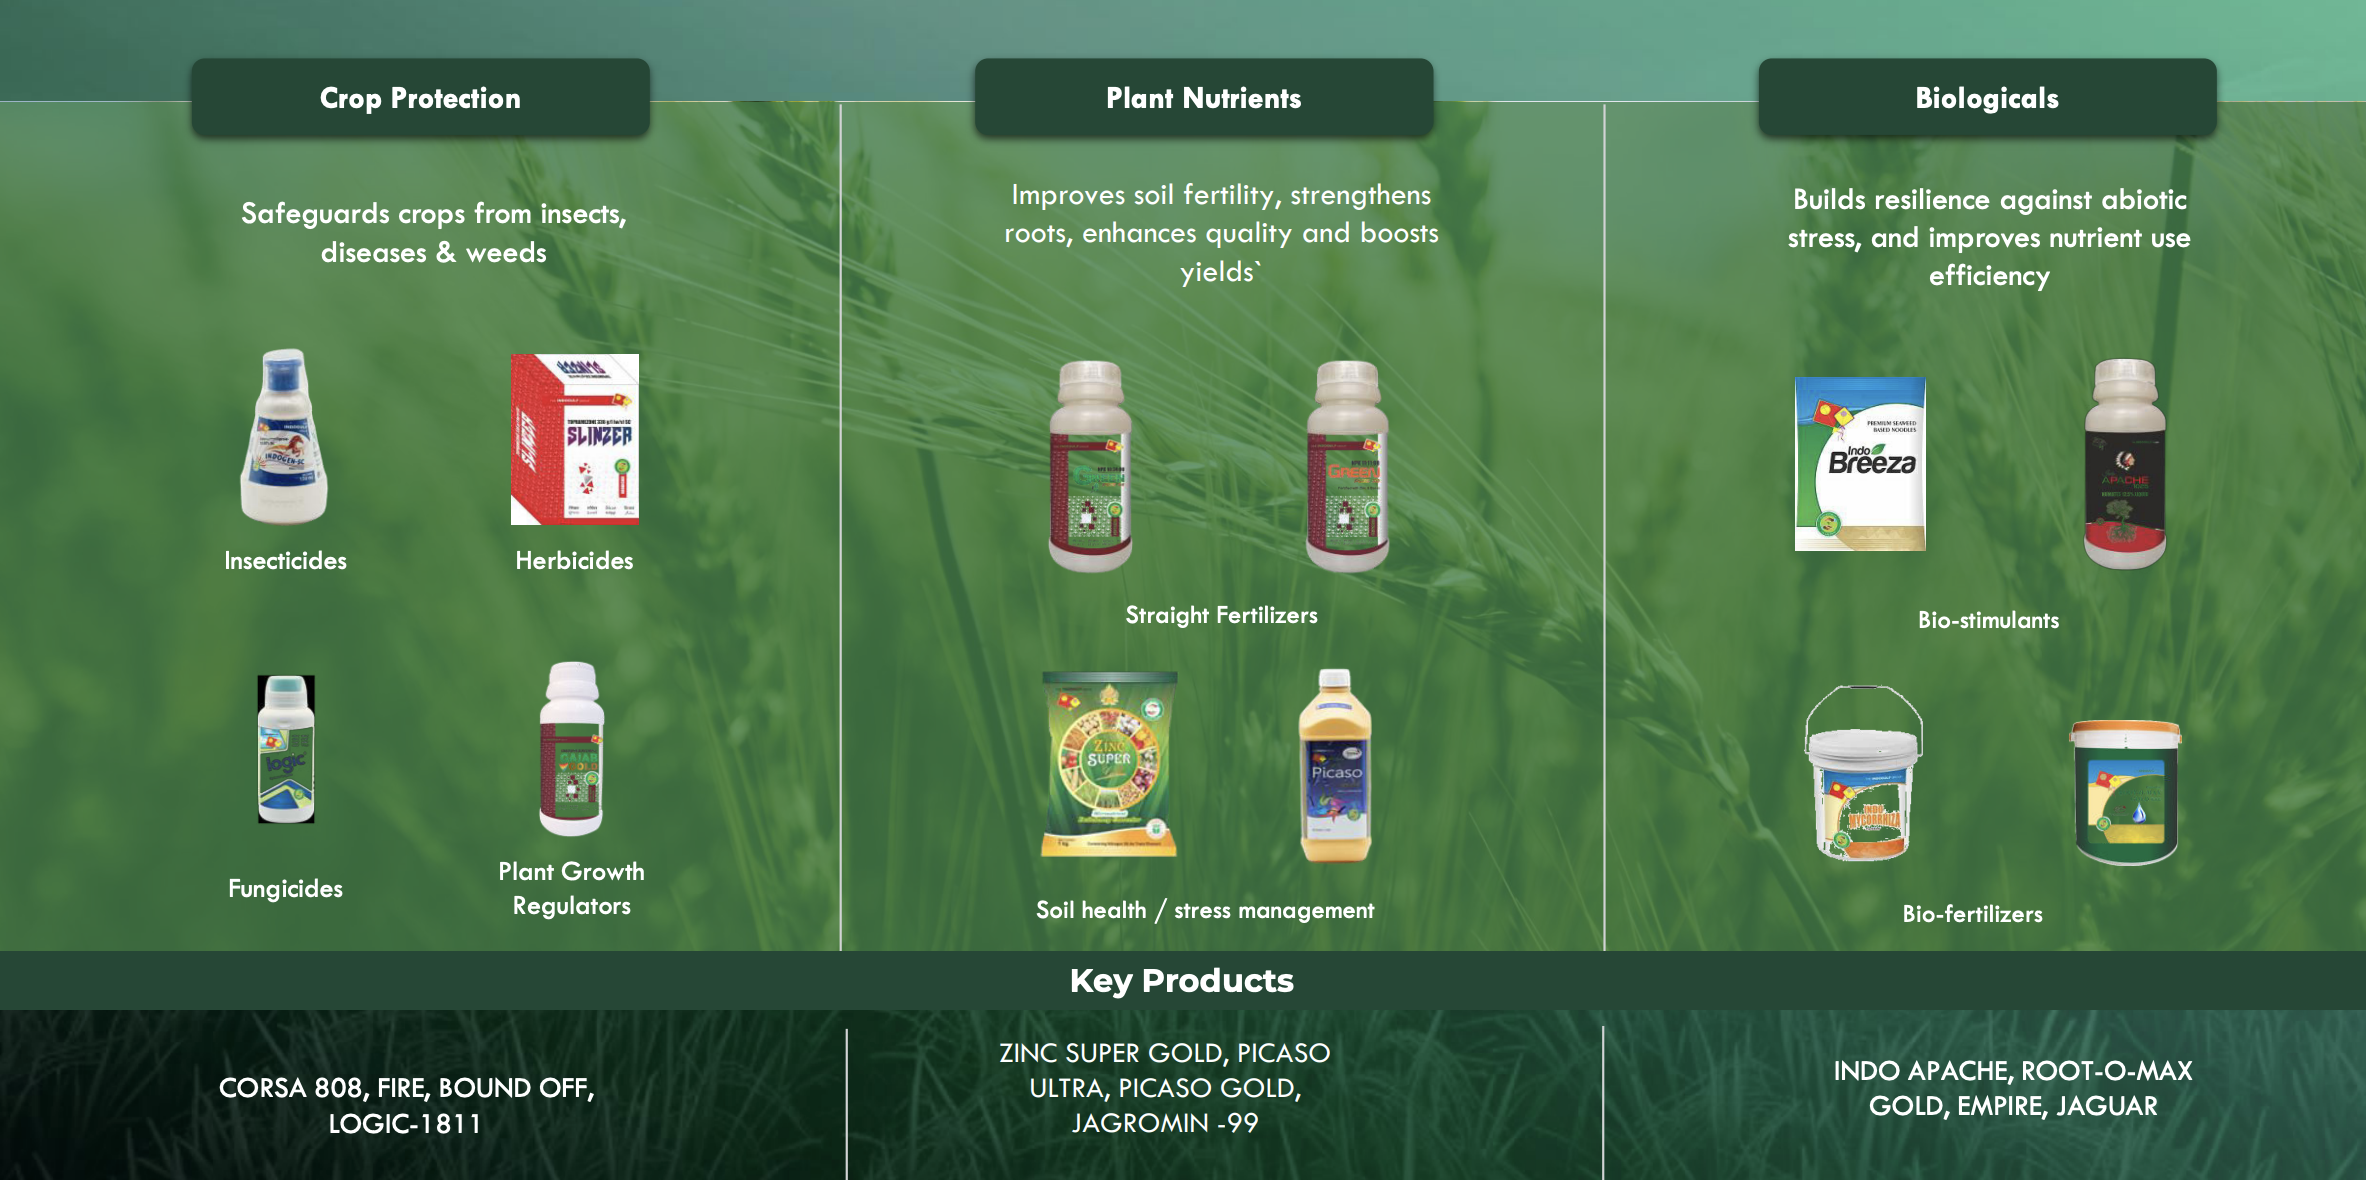
It peddles crop protection (insecticides, fungicides, herbicides), plant nutrients, and biologicals across India via 7,000+ B2C distributors and 192 institutional buyers. Exports now touch 34 countries, though they account for only 11% of revenue. The advisory model—100,000 farmers engaged, 100 field agents across India—frames the newer pitch: less “sell agrochemicals,” more “engineer crop outcomes.”
Recent moves: ICRA upgraded the credit rating to A- (Stable) in October 2025, scrubbing the “issuer not cooperating” tag. Management lined up MOUs with ICAR-IARI under the Prime Minister’s Doctoral Fellowship for phenomics research. New product launches have contributed 16% of FY26 revenue, signalling the push toward specialty over commodity.
3. Business Model: WTF Do They Even Do?
Indogulf makes three things.
Crop protection (85% of FY26 revenue) is the heavy hitter: insecticides (59% of the mix—stuff like Abamectin and Chlorantraniliprole), fungicides (29%), and herbicides (11%). These come as formulations (ready-to-use) or technicals (raw actives). The company has backward-integrated into technicals at Nathupur-II, making Bifenthrin and Lambda-cyhalothrin in-house, which cuts import exposure and improves margins.
Plant nutrients (5% of revenue) bracket straight fertilizers (Zinc Super Gold, Picaso Ultra), micronutrients, and soil-health products. Barely a whisper of revenue but positioned as the margin play—specialty micronutrients beat commodity phosphate every time.
Biologicals (6% of revenue) bundle bio-stimulants and bio-fertilizers (Indo Apache, Root-o-Max Gold, Empire, Jaguar). Same story: small-scale now, but the narrative is “resilience against abiotic stress” and the full crop cycle, not a spray-and-pray pesticide.
The go-to-market splits roughly 50% B2C (retail distributors), 38% B2B (institutional—governments, co-ops, agribiz), and 11% exports. The B2C channel is wide but shallow; B2B is narrower but deeper. Exports are young and scattered: Venezuela’s first nutrient shipment in FY26, Taiwan for technicals, Sri Lanka for biostimulants.
The real kicker is the distribution subsidiary AGPL (Abhiprakash Globus), launched to attack “underserved rural markets” that the main network doesn’t reach. Management added 1,300–1,400 channel partners via AGPL in FY26 and plans two new states (Chhattisgarh, Odisha) in FY27. It’s a scaling lever: same factories, new tributaries.
The headache: agrochemicals are commoditized, regulated to death, and vulnerable to weather, pest cycles, and government bans. In October 2023, four pesticides were axed (dicofol, dinocap, methomyl, monocrotophos). Another 24 linger in regulatory purgatory. Customers are sticky only when the crop fails. Margins are razor-thin unless you own the technical or have a licensed formulation no one else can legally copy.
4. Financials Overview
Figures are consolidated, in ₹ crore.
Quarterly Results (Q4 FY26 vs Q4 FY25):
Metric
Latest Q (Q4 FY26)
YoY
QoQ (vs Q3 FY26)
Revenue
150.82
+19.5%
-39.2%
EBITDA
20.37
-1.5%
-36.3%
PAT
11.61
+21.4%
-43.9%
EPS (annualised)
7.32
N/A
N/A
The Q4 frame is seasonally weak (agrochemical sales peak in monsoon prep—June to September), but the drop from Q3’s ₹248 crore in revenue to Q4’s ₹151 crore is sharp. Management cited “inventory normalization,” lower pest incidences, and heavy rainfall in certain regions. EBITDA margin contracted to 13.5% in Q4 from 16.5% in Q4 FY25, pinched by higher employee costs (Q4 jumped 35% YoY to ₹156 crore across all expenses) and commodity volatility.
Net profit margin stayed respectable at 7.7% in Q4 but is down from 8.0% last quarter, signalling the squeeze trickling through.
Full-Year Results (FY26 vs FY25):
Metric
FY26
FY25
Growth
Revenue
704.63
590.42
+19.3%
EBITDA
73.87
64.29
+14.8%
PAT
40.03
31.47
+27.1%
EPS
6.33
6.45
-1.9%
The year-over-year numbers look good on the headline: revenue up 19%, PAT up 27%. But EPS inched down—why? The denominator expanded. Management executed a share split (1:2) in FY25, which more than doubled the share count. So the ₹6.33 EPS in FY26 on a larger base is actually lower than the nominal ₹6.45 EPS from the prior year on fewer shares. The “profit growth” is real; the “per-share” growth isn’t.
Management emphasized product mix uplift—12 new products launched in FY26, and “high-margin specialties” contributed meaningfully. That’s why PAT (profit after tax) grew faster than revenue: gross margins expanded from 29.8% (FY25) to 31.0% (FY26), despite input volatility. EBITDA margin ticked up to 10.4% from 10.9%—a slight compression year-on-year, but context matters: cost inflation in employee wages and other operating expenses ate much of the gross-margin gain. The company bought scale but paid for it in headcount.
Concall Highlights (May 29, 2026):
Management characterized FY27 as the year of “integrated crop solutions.” The term is marketing, but the execution is real: three new product launches planned (a potash-derived nutrient, a herbicide combo for pulses/soybean, and a fungicide in August tied to an expiring patent). R&D spend is modest (₹14.65 crore in 9M FY25), but the ICAR-IARI collaboration will produce phenomics data for next-gen formulations by FY28.
On margins, management flagged El Niño risk for FY27—potential South India weakness in Q2 if monsoon patterns shift. That’s a 3-5 month visibility problem, not a full-year conviction call. Working capital is “largely secured” for Q1 FY27 but Q2 raw-material sourcing looks murkier due to geopolitical tensions (Iran-Israel, crude volatility, logistics cost swings).
Capacity utilization improved to 52% in FY26 (from 44% in FY23), a healthy trend, but still slack. Peak utilization on some lines hits 80-100%, but annual averages are lower due to multi-product readiness and seasonality. Management hasn’t lowered the ambition: they see “four-digit revenue” (₹1,000+ crore) “very shortly, in the next 2-3 years.” Barwasni’s expansion (₹76 crore capex incurred, ₹8-10 crore left) will add 30-40% capacity; commissioning depends on regulatory approvals (CIB, state pollution, fertilizer licenses). Targeted by Q3/Q4 FY27, but construction lost 4 months to Delhi’s GRAP restrictions.
5. Market Expectations & Historical Multiples
This section describes how the market is currently pricing the company and how that compares with its own history and peer group. It is descriptive, not predictive.
Metric
Current
Historical Average (5Y)
Peer Median (24 peers)
P/E
9.75
12.5
23.5
ROCE
12.2%
12.3%
15.3%
ROE
10.9%
12.1%
11.4%
PAT Margin
5.6%
5.2%
6.2%
D/E
0.40
0.62
0.55
The market currently pays 9.75x earnings here versus a peer median of 23.5x—a 59% discount. On a 5-year basis, Indogulf itself traded at 12.5x average, so the current multiple is 22% below that mean.
What is the market pricing in? Slowing return profile. ROCE (return on capital employed) sits at 12.2%, a tick below the 5-year average of 12.3% and well below peer median of 15.3%. The company generates decent returns, but not as efficiently as peers like Bayer Crop Science (29.1% ROCE), Sumitomo Chemical (23.5%), or Sharda Cropchem (30.4%). Indogulf’s ROE of 10.9% is barely above peer median (11.4%), and it’s drifted down from a 5-year average of 12.1%.
Why the discount? Working capital intensity is the culprit. Debtors remain elevated (125 days in FY26, down from 138 days in FY25), and