1. At a Glance
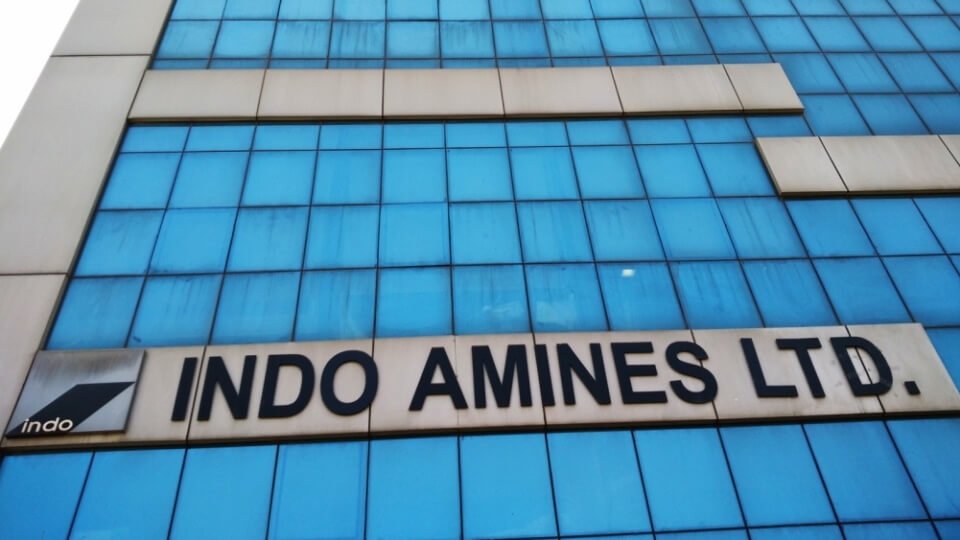
Indo Amines is the introvert of the speciality chemical world. Doesn’t scream, doesn’t trend on FinTwit, and yet — delivers a5-year profit CAGR of 34%, runs ondouble-digit margins, and just clocked its best-ever quarter. With a stock P/E of 15 and ROE of 19%, it’s like discovering your shy lab partner owns a meth lab (legal one) and makes more than the principal.
2. Introduction
While everyone chases mega-cap drama like Deepak Nitrite’s fluorine flames or Pidilite’s Fevicol monopoly, Indo Amines quietly runs a ₹1,100 crore operation pumping out niche chemicals for pharma, ink, fragrances, and even pesticides (no, not to kill investors).
The company has taken the slow-and-steady compounding route — no IPO drama, no 100x hype. And in Q1 FY26, it casually posted ₹29 Cr in profit, a 2x jump QoQ. That’s not “fine” chemicals. That’s damnrefined.
But all’s not squeaky clean. Promoter stake has dropped from69% to 58%in under 2 years. Dividend? ₹0.50 per share — enough to buy a stale samosa. Still, margins are improving, capacity is being added, and the stock trades at a steep discount to its sector peers. The risk-reward brew smells… complex.
3. Business Model (WTF Do They Even Do?)
Indo Amines manufacturesspeciality, fine, and performance chemicalsused across:
- Agrochemicals & Pharmaceuticals
- High-performance polymers
- Paints, printing inks, dyes, pigments
- Fragrances, flavours, and surfactants
- Rubber & Homecare formulations
This isn’t a “one formula fits all” game. Customers need customization, batch-to-batch consistency, and purity. So Indo doesn’t just sell a drum of chemicals — it sells process knowledge, long-term B2B relationships, and chemical credibility.
It has three main manufacturing facilities across Maharashtra and Gujarat, and a growing export book. Think of it as the Costco of custom chemicals — bulk buyers only, margins controlled by process efficiency, not by branding.
4. Financials Overview
Let’s toss the numbers into the cauldron and see what boils:
- TTM Revenue:₹1,101 Cr
- EBITDA:₹105 Cr → EBITDA Margin: ~9.5%
- Net Profit:₹66 Cr → PAT Margin: 6%
- EPS (TTM):₹9.11
- P/E:136 ÷ 9.11 =14.9x
- ROE:19.3%
- ROCE:18.3%
Q1 FY26:
- Revenue: ₹288 Cr
- EBITDA: ₹31 Cr
- Net Profit: ₹29 Cr
- EPS: ₹3.97
Verdict? After two muted years, margins and profits are back in the lab coat. And this time, the results aren’t explosive — they’re surgical.
5. Valuation – Fair Value Range
| Method | Calculation | Fair Value (₹) |
|---|---|---|
| P/E | EPS ₹9.11 × Sector Avg P/E ~18 | 164 |
| EV/EBITDA | EV ₹1,059 Cr ÷ EBITDA ₹105 = 10.1x | 155 |
| DCF | 18% profit CAGR, 10% discount rate | 150 |
Fair Value Range: ₹150 – ₹165
“This FV range is for educational purposes only and is not investment advice.”
6. What’s Cooking – News, Triggers, Drama
- Q1 FY26 Net Profit:₹29 Cr — best in company history.
- Dividend:₹0.50/share. Not huge, but better than zero.
- Cost Auditor Re-appointed:Nothing screams excitement like compliance.
- AGM via Zoom on Sept 24— because physical meetings are overrated.
- Promoter Stake Droppedto 58.42% from 69% in 2022. Still majority, but what’s the hurry, folks?
7. Balance Sheet
| Item | Mar 2025 (₹ Cr) |
|---|---|
| Total Assets | 779 |
| Net Worth | 317 |
| Borrowings | 284 |
| Total Liabilities | 462 |


