


At a Glance
The Indian Wood Products Co Ltd (IWP) – century-old katha & spice trader – posted a tiny ₹1.15 Cr profit in Q1 FY26, down 9% YoY. Sales slipped to ₹51.4 Cr, margins barely stayed at 7.7%, and the stock drifts at ₹37.4. Yes, the P/E is a dizzying 46x for a company with ROE barely 1.5%. Someone’s overpaying for paan-flavored nostalgia.
Introduction
Imagine a company that’s been around since 1919 and still makes profits smaller than your chai budget. That’s IWP. They sell katha (the stuff that makes your paan red) and dabble in spices. While the brand name carries history, the financials scream “retired but not expired”.
Business Model (WTF Do They Even Do?)
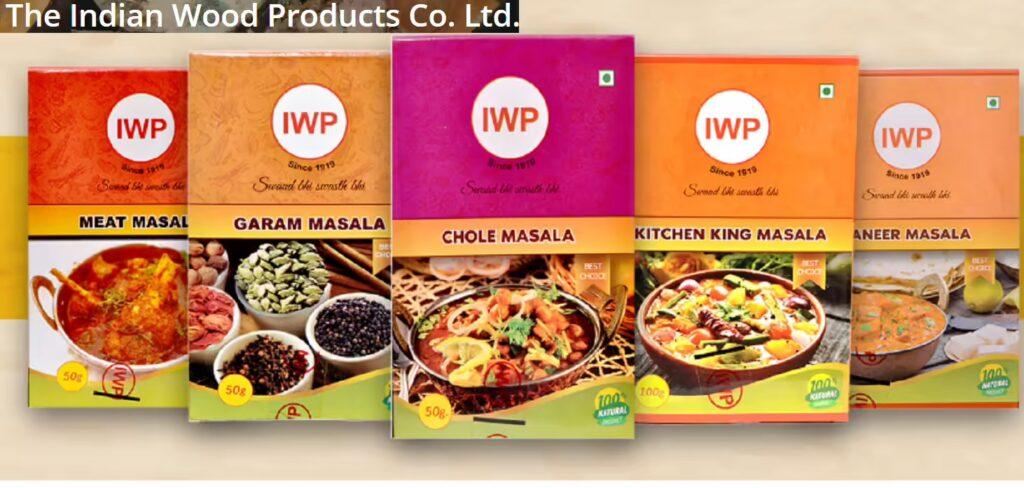
- Core Segments:
- Katha manufacturing
- Spices retailing
- Brands: IWP – old school, known in paan shops.
- Roast: 100+ years old but still struggling with growth – maybe katha isn’t the future.
Financials Overview
Q1 FY26
- Revenue: ₹51.4 Cr (↓9% YoY)
- Operating Profit: ₹3.95 Cr
- OPM: 7.7%
- PAT: ₹1.15 Cr
- EPS: ₹0.18
FY25
- Revenue: ₹226 Cr
- PAT: ₹5 Cr
- ROE: 1.5%
Comment: Profits are an afterthought, growth is sluggish, and margins are fragile.
Valuation
- P/E Method
- EPS TTM: ₹0.81
- Sector P/E: 20x
- Value ≈ ₹16
- Book Value
- BV: ₹56
- CMP/BV: 0.66x
- Value ≈ ₹40 (if generous)
- EV/EBITDA
- EBITDA TTM: ₹15 Cr
- Multiple: 5x
- Value ≈ ₹25
🎯 Fair Value Range: ₹20 – ₹40
CMP ₹37.4 → fully priced, maybe slightly over.
What’s Cooking – News, Triggers, Drama
- No major triggers – stable but stagnant business.
- Dividend payout: 18% (okay but tiny).
- Risk: Demand slowdown, rising input costs.
- Trigger: None, unless they spice up the product line.
Balance Sheet
| (₹ Cr) | Mar 2025 |
|---|---|
| Assets | 541 |
| Liabilities | 182 |
| Net Worth | 360 |
| Borrowings | 80 |
Remark: Low debt but weak returns.
Cash Flow – Sab Number Game Hai
| (₹ Cr) | FY23 | FY24 | FY25 |
|---|---|---|---|
| Operating | 12 | 10 | 14 |
| Investing | -3 | -2 | -5 |
| Financing | -5 | -10 | -8 |
Remark: Cash flow is positive but not growing.
Ratios – Sexy or Stressy?
| Metric | Value |
|---|---|
| ROE | 1.5% |
| ROCE | 3.3% |
| P/E | 46x |
| PAT Margin | 2.3% |
| D/E | 0.22 |
Remark: Valuation high, returns pathetic.
P&L Breakdown – Show Me the Money
| (₹ Cr) | FY23 | FY24 | FY25 |
|---|---|---|---|
| Revenue | 182 | 192 | 226 |
| EBITDA | 10 | 14 | 15 |
| PAT | 2 | 4 | 5 |
Remark: Growth is as slow as a paan seller on a rainy day.
Peer Comparison
| Company | Revenue (₹ Cr) | PAT (₹ Cr) | P/E |
|---|---|---|---|
| Indian Wood Prod. | 221 | 5 | 46x |
| Pratik Panels | 3 | 0.3 | 137x |
| National Plywood | 40 | -0.5 | N/A |
Remark: The whole sector is sleepy; IWP is just the least sleepy.
Miscellaneous – Shareholding, Promoters
- Promoters: 71%
- FIIs: None
- DIIs: Negligible
- Public: 28.5%
Observation: Stable promoter holding, no big institutional interest.
EduInvesting Verdict™
IWP is a nostalgic brand surviving on a niche product. Growth is flat, profits are minuscule, and valuation is unjustified. Unless they diversify or scale, the stock may stay range-bound.
SWOT Quickie
- Strengths: Legacy brand, stable cash flows.
- Weaknesses: Low ROE, poor growth.
- Opportunities: Expand spices business aggressively.
- Threats: Competition, changing consumer habits.
Final Word: For investors, this is like chewing a bland paan – not much kick.
Written by EduInvesting Team | 30 July 2025
SEO Tags: Indian Wood Products Q1 FY26 Results, IWP Katha Business, Indian Wood Products Analysis


: Investors Strap In for a Bumpy, Billion-Euro Ride")


