India Pesticides Q3 FY26: ₹226 Cr Sales, ₹23 Cr PAT, 31% YoY Growth – But 211-Day Working Capital Says “Hold My Chemical”
1. At a Glance – The Agrochemical That Smells Like Opportunity… and Inventory
At ₹172 per share, with a market cap of ₹1,970 crore, India Pesticides Ltd is trading at a P/E of 17.4 in an industry where the median P/E is flirting around 28+. Q3 FY26 sales came in at ₹226 crore (up 31% YoY), and PAT stood at ₹23 crore (up 33% YoY). Sounds spicy, right?
ROCE is 13%, ROE is 9.73%, debt-to-equity is a harmless 0.03 (almost debt-free vibes), and the stock is up 19.5% over one year but down 5.9% in the last three months. Classic “long-term patient, short-term moody” behavior.
But here’s the masala: operating cycle ballooned to 211 days in FY24, and cash conversion cycle hit 255 days in FY25. This isn’t a business cycle — this is a chemical marination cycle.
So the question is simple:
Is this a temporary demand hiccup in agrochemicals, or is the balance sheet quietly screaming for help while the P&L smiles politely?
Let’s dissect.
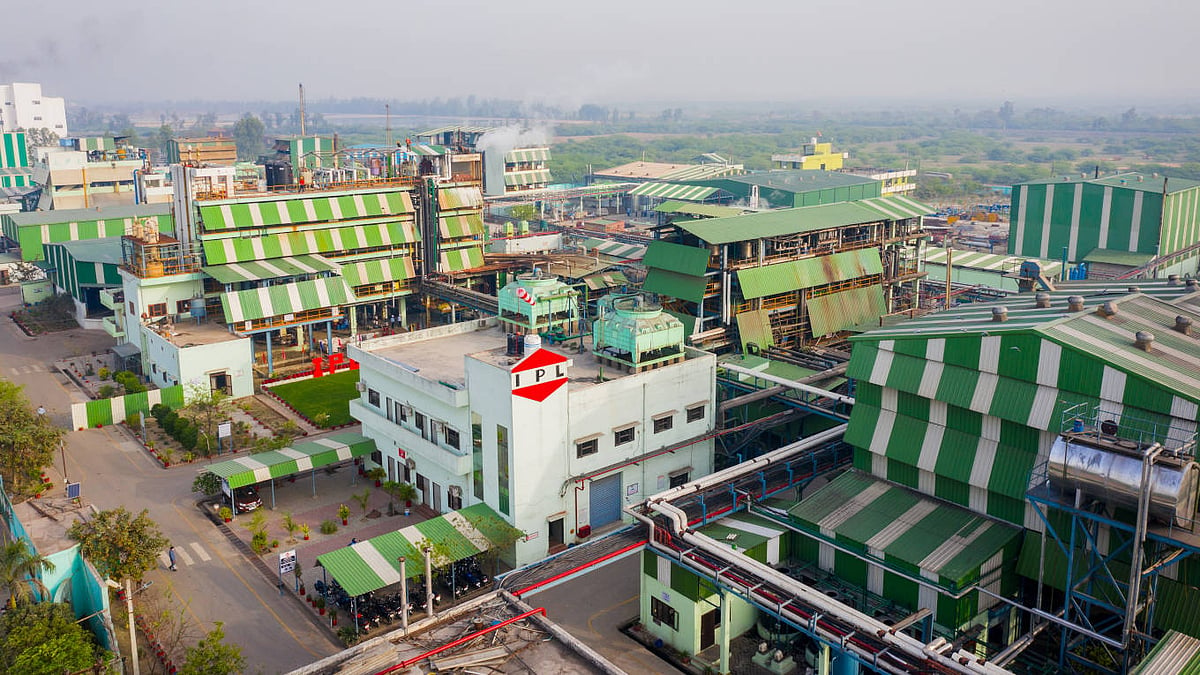
2. Introduction – The Sole Indian Manufacturer Flex
Founded in 1984, India Pesticides Ltd (IPL) isn’t your average pesticide mixer. It claims leadership as the sole Indian manufacturer and among the top five globally for technicals like Folpet, Captan, and Thiocarbamate herbicides.
Translation: They don’t just pack and sell bottles — they manufacture the core molecules.
Revenue mix FY24:
Technicals + APIs: 72%
Formulations: 28%
Geographically:
Domestic: 60%
Exports: 40%
Exporting to 25+ countries
Manufacturing capacity:
Technical chemicals: 24,200 MTPA
Formulations: 6,500 MTPA
They operate from Lucknow and Sandila (Uttar Pradesh). Around 67% of raw materials are sourced locally. That’s cost control with a desi twist.
But here’s the catch — when MNC customers shift from placing orders 3–6 months in advance to just one month, inventory rises. And inventory rising in chemicals isn’t cute. It’s expensive.
So IPL is either:
Positioned for a demand recovery
Or sitting on a warehouse of hope
Which one is it?
3. Business Model – WTF Do They Even Do?
Let’s simplify.
They operate in three segments:
1. Technicals (The Real Chemical Brain)
These are generic agrochemical technicals — fungicides, herbicides, insecticides. They sell these to other companies who then formulate and sell branded products.
This is B2B, high-volume, molecule-driven business.
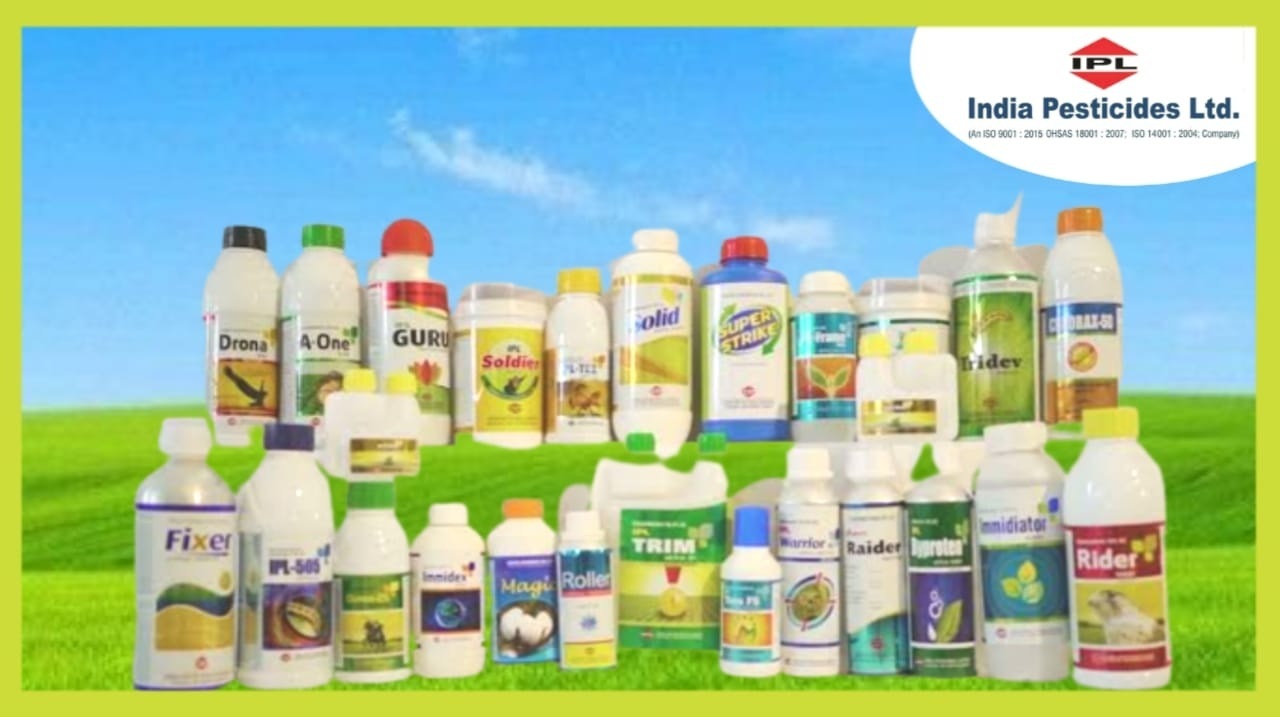
2. Formulations
Crop-specific finished products sold to farmers via 4,712 dealers across 17 states. This is higher margin but competitive.
3. APIs
They make dermatology-focused APIs, especially anti-fungal and anti-scabies products.
So IPL is basically:
A molecule manufacturer
A formulation blender
And a small pharma side hustle operator
They launched 14 new products in FY23 and have two in-house R&D labs.
Question for you:
Would you rather be a molecule supplier with stable global demand… or a brand-driven agro retailer fighting 50 competitors?
4. Financials Overview – Q3 FY26 Numbers Locked
Result Type Detected: Quarterly Results (Q3 FY26) EPS Annualisation Rule Applied: For Q3 → Average of Q1, Q2, Q3 EPS × 4