Search for Stocks /

Radiant Cash Management Services Ltd — FY26: The Core Holds, the Subsidiaries Do Not

Spotted a factual error — a wrong number, date, or fact? Tell us and we will check the source.

General information and entertainment, not investment advice. The author is not a SEBI-registered adviser or research analyst. No recommendation, no promised returns. Markets carry risk including loss of capital. Figures may not be current. Consult a registered adviser before acting.


1. At a Glance

Radiant Cash Management Services closed FY26 with consolidated revenue of ₹429 crore — essentially flat on ₹427 crore in FY25, a 0.5% crawl that management attributed, per the earnings call, to two discrete client losses: several railway regions surrendered to competition and a large e-commerce logistics client absorbed by a larger acquirer. Those two events cost roughly ₹13–14 crore in annualised revenue, per management’s quantification on the concall.

The more pointed number is PAT. Consolidated profit after tax fell to ₹28 crore from ₹47 crore the prior year — a 40% drop — with the earnings call attributing the deterioration largely to losses in the fintech subsidiary Aceware and the valuables logistics arm Radiant Valuable Logistics. The standalone business, by contrast, delivered ₹38 crore PAT on ₹401 crore revenue, a more orderly 16% decline from ₹46 crore the year before.

A ₹3.13 crore fraud in Aceware, classified as an exceptional item, further weighted the consolidated line. The board approved a ₹2.5 per share final dividend despite the earnings compression — a payout ratio that, at 83% of consolidated PAT, strains the definition of “sustainable distribution.”

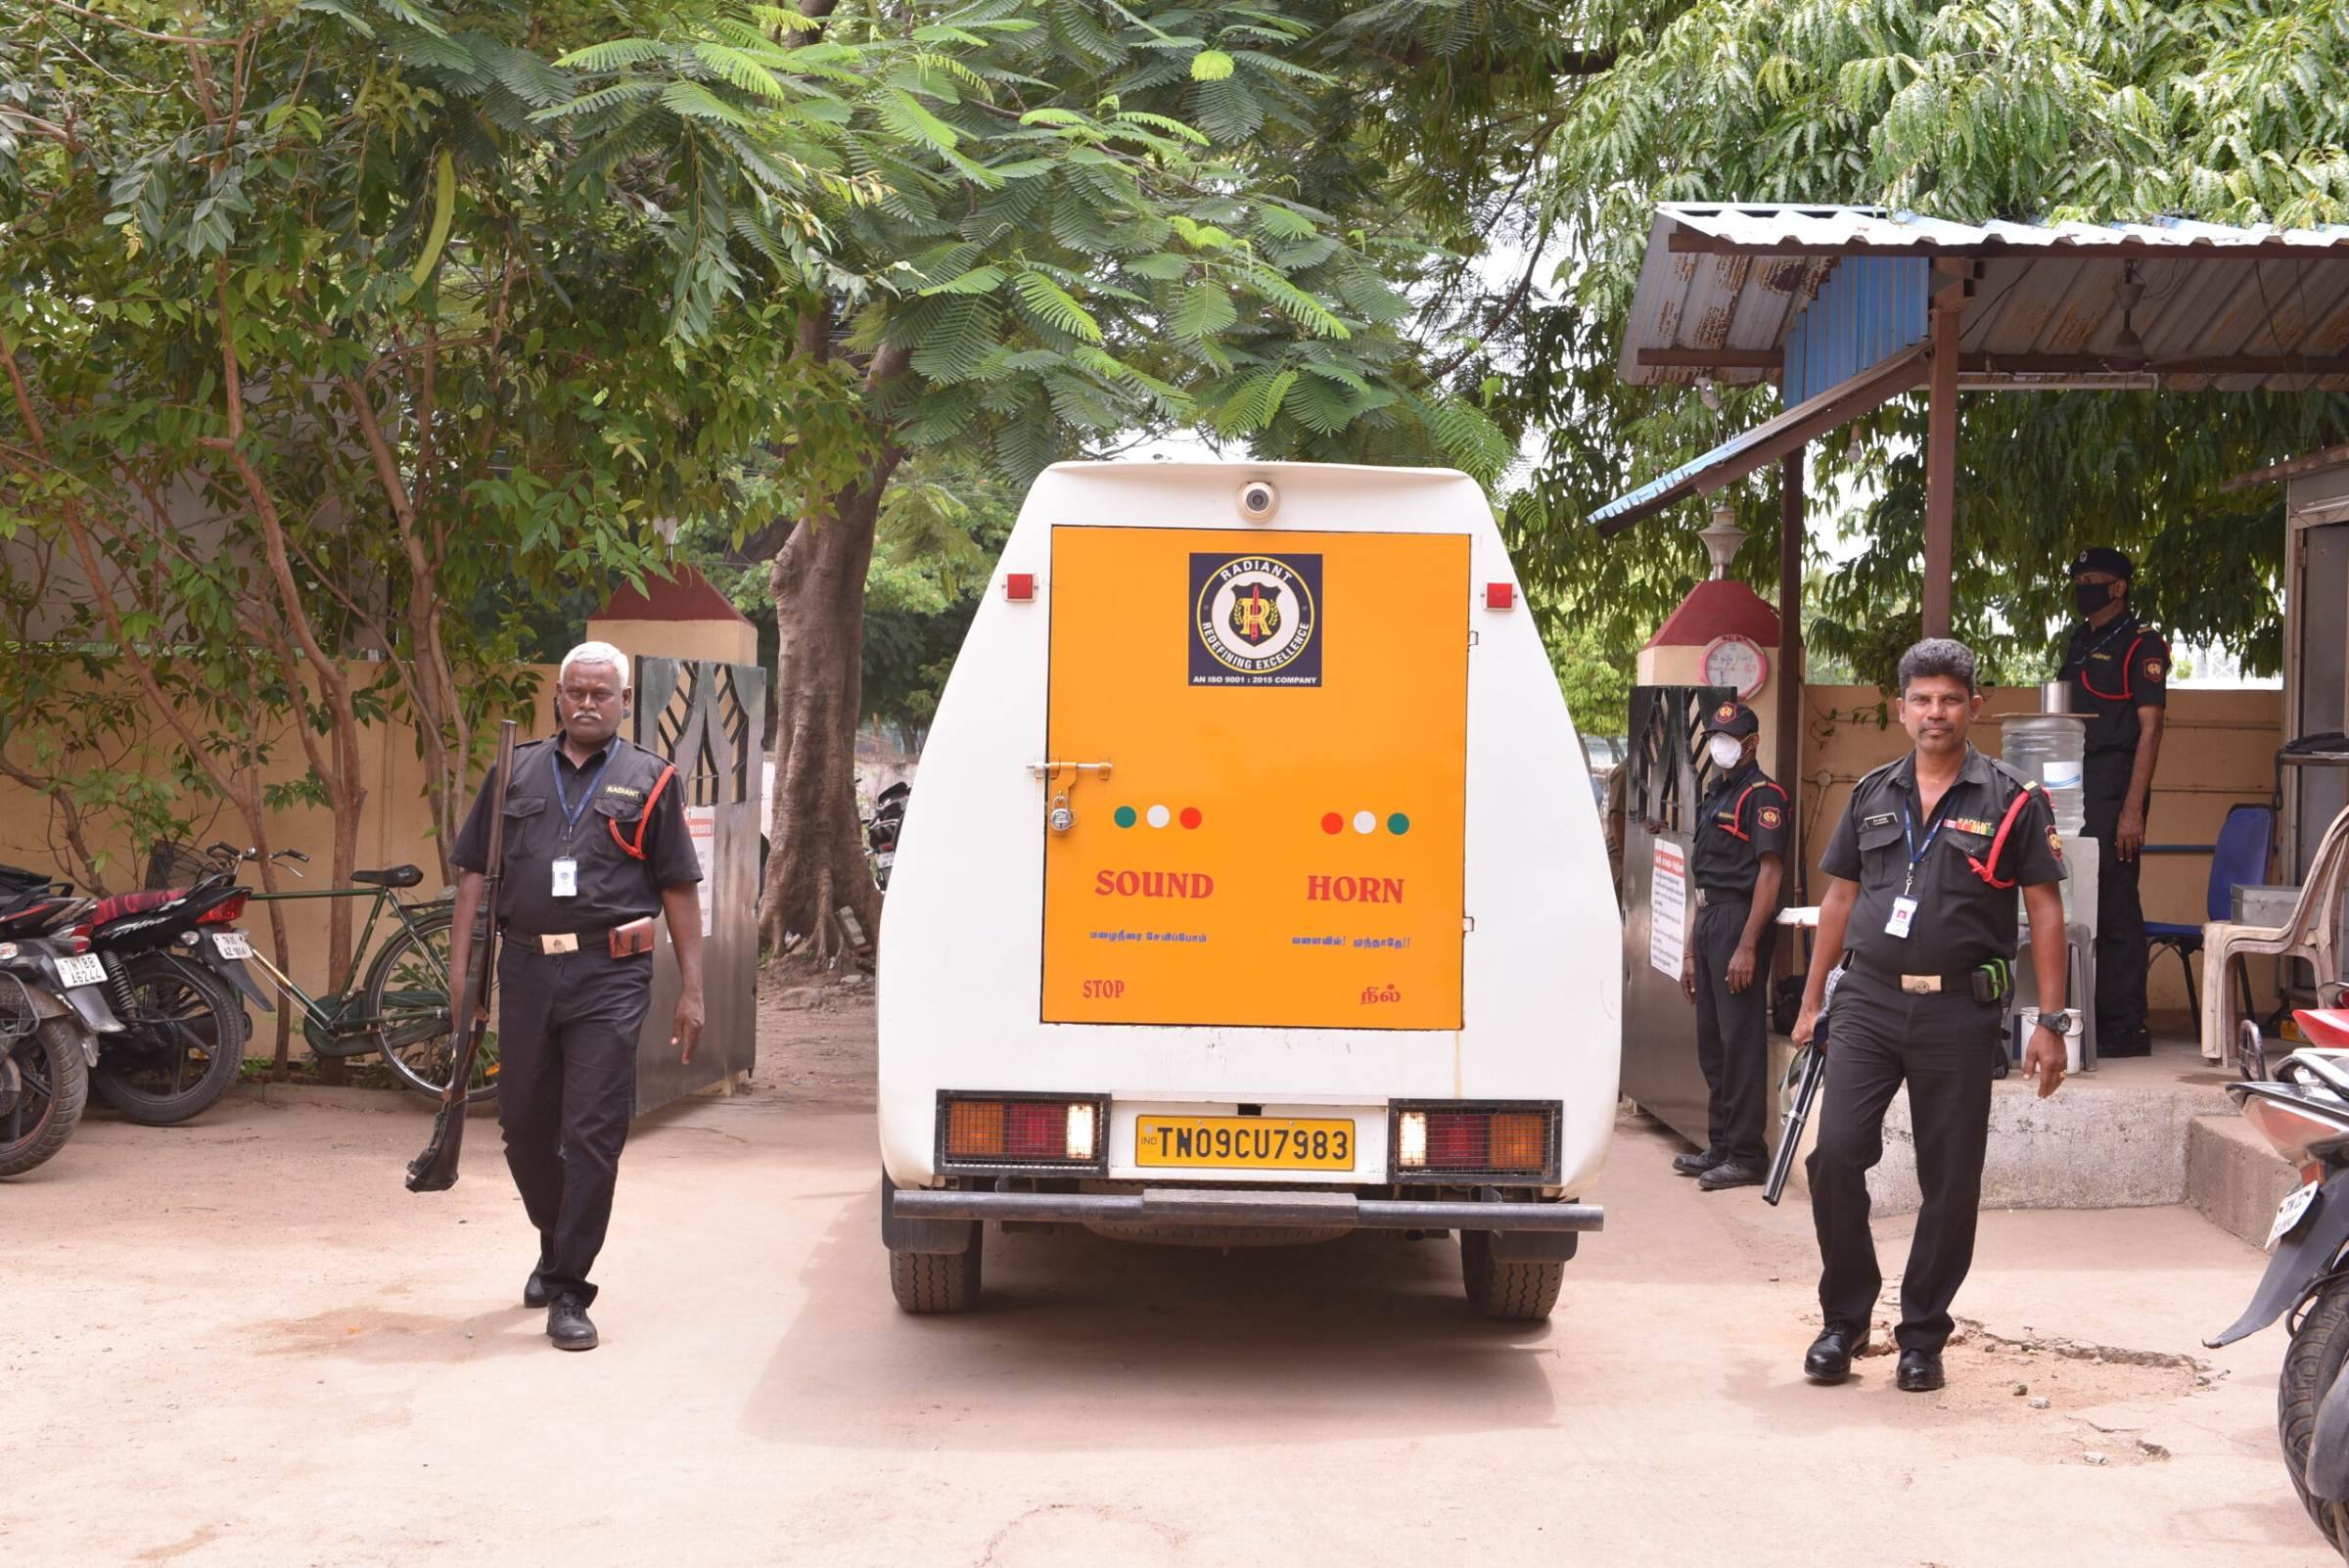
The core cash logistics franchise — 77,521 touch points, 870 armoured vans, ₹1,694 billion in cash handled — kept moving. Whether the subsidiaries follow in FY27 as management expects is the unresolved question this period leaves open.


2. Introduction

Radiant Cash Management Services was incorporated in 2005 and listed more recently as a mid-cap play on India’s physical cash infrastructure. The company operates from Chennai and describes itself as an integrated cash logistics player, with particular depth in Tier 2 and Tier 3+ geographies — roughly 82% of touch points and 84% of revenues originate outside metro cities, per the investor presentation.

FY26 arrived as the year the diversification thesis met operational reality. In FY24 the company had acquired a 56.93% stake in Aceware Fintech Services, entering the business correspondent and digital payments space — POS terminals, sound boxes, micro ATMs. In August 2023 it had also launched Radiant Valuable Logistics, targeting movement of diamonds, jewellery, gold, and high-value items. Both ventures remain loss-making as of March 31, 2026.

On the core business, FY26 saw two client exits that management described explicitly on the concall: loss of railway regions to competition (roughly ₹9–10 crore annualised) and the departure of a large e-commerce logistics client that was acquired by a larger player (roughly ₹4 crore annualised). Offsetting those, management cited 21% annual growth in the e-commerce vertical within core served sectors, along with strong performance in petroleum and organised retail.

The company added 118 new clients and 230 new end customers during FY26, and covered 14,844 pin codes by year-end. A new large project from an existing customer commenced April 1, 2026 — FY27 day one — which management on the concall suggested could add approximately 3–4% to FY27 revenue.


3. Business Model: WTF Do They Even Do?

Radiant’s core business is deceptively simple: it picks up cash from wherever cash accumulates — a pharmacy in Gorakhpur, a petrol station in Tirunelveli, a jewellery shop in Ludhiana — and deposits it into the client’s bank account. It is, in the most literal sense, a company that drives around India with armoured vans collecting the country’s physical currency.

The five service lines from the investor presentation:

Cash Pick-Up & Delivery — the flagship, contributing 61% of FY26 revenues. Fixed per-point per-month fee depending on location and daily cash limit. Growth comes from adding points, particularly in Tier 3+ towns where banks have thin branch networks.

Network Cash Management — 21% of FY26 revenues. A value-added layer: Radiant deposits client cash into Radiant’s own bank account in locations where the client has no branch, then electronically transfers the funds. Revenue is variable, tied to volumes deposited. Effectively a float-plus-logistics play.

Cash Van Operations — 12% of revenues and growing. Armoured vans leased with full crew to banks for bulk inter-branch cash transfers. Fixed per-van per-month fees. Management noted on the concall that dedicated cash van contracts are a priority growth area, with “two, three more large contracts in pipeline” beyond a recently signed large contract.

Cash Processing — 5% of revenues. Cash counted and verified at point of pick-up rather than sealed-bag collection. Additional fee per service.

Others — 2%. Includes “Man Behind Counter” (uniformed staff stationed at high-footfall retail), and vault rentals.

By industry, BFSI is the dominant client at 34% of FY26 revenues, followed by organised retail at 19%, e-commerce at 19%, and petroleum at 4%. Railways slipped from 3.4% to 1.6% of revenues, per the presentation — a visible scar from the client loss.

The company runs this with 9,875 people, 870 fabricated armoured vans, 21% of total staff drawn from ex-armed forces backgrounds. Cash losses in FY26 were ₹3.33 crore against ₹1,694 billion moved — 0.002% of cash handled, which management on the concall described as “one of the best performance in the industry.”

Two subsidiaries now sit alongside this core. Aceware Fintech (58%+ stake), handling POS, sound boxes, and business correspondent services — ₹100 crore in revenue, ₹10 crore PAT loss in FY26, per management. Radiant Valuable Logistics (RVL), handling high-value goods movement — ₹6.07 crore in revenue, ₹6 crore EBITDA loss, per management.

The business model wisdom: scale in cash logistics is a distribution game, not a margin game. The company with the most points wins the contract; the company with the lowest cash-loss ratio keeps it.


4. Financials Overview

Figures are consolidated, in ₹ crore.

Annual Results:

MetricFY24FY25FY26YoY
Revenue386427429+0.5%
EBITDA829345-52%
PAT444728-40%
EPS (₹)4.194.363.02-31%

Note: EBITDA per Screener data (operating profit line). The investor presentation reports EBITDA of ₹54.35 crore for FY26, excluding the ₹3.125 crore exceptional item (Aceware fraud). The Screener operating profit line of ₹45 crore reflects the consolidated income statement including subsidiary losses at the operating level.

Latest Quarter (Q4 FY26, per the consolidated filing):

MetricQ4 FY26Q3 FY26QoQQ4 FY25YoY
Revenue₹101 Cr₹124 Cr-18.7%₹104 Cr-3.4%
EBITDA₹11.1 Cr₹17.5 Cr-36.6%₹15.2 Cr-27.0%
PAT₹3.0 Cr₹11.6 Cr-74.5%₹8.4 Cr-64.7%
EPS (₹)0.511.030.79

Q4 was the weakest quarter of the year. Management attributed the consolidated EBITDA margin of 10.7% in Q4 to losses in Aceware and RVL, per the concall. The standalone Q4 EBITDA margin stood at 15%, described as “continuing an improving trend” from cost reduction measures, management said.

Concall highlights (June 2026):

Management stated that consolidated FY26 PAT of ₹28 crore was “largely on account of losses incurred in the fintech subsidiary.” The CFO quantified the exceptional item impact at approximately ₹3.1 crore. On Aceware, management described the PIDF subsidy ending in December 2025 as the key Q4 headwind, and stated targets for both subsidiaries to achieve breakeven in H1 FY27. Management’s stated FY27 objective is consolidated revenue of approximately ₹500 crore with 11–12% PAT margins — a target that would require PAT roughly doubling from FY26 levels. Management described this as an objective, not formal guidance.


5. Market Expectations & Historical Multiples

This section describes how the market is currently pricing the company and how that compares with its own history and peer group. It is descriptive, not predictive.

MetricCurrentHistorical AveragePeer Median
P/E13x18.5x
EV/EBITDA7.2x
P/B1.5x
ROE12.5%16% (3-yr)13.2%
ROCE9.96%26% (FY25)

The market currently pays 13x earnings here against a peer-group median of approximately 18.5x, per Screener’s peer table.

ROCE has compressed from 26% in FY25 to 9.96% in FY26 — a single-year drop that reflects the consolidated drag from loss-making subsidiaries rather than a change in the core logistics economics. The 3-year average ROE of 16% compares to the current 12.5%, with the gap traceable to the same subsidiary losses, per the filings.

EV/EBITDA at 7.2x sits against a ₹389 crore enterprise value, reflecting a market cap of ₹420 crore partially offset by net cash disclosed by management at roughly ₹60 crore of free cash (the remaining balance being customer float that cycles within 48 hours, management said on the concall).

The market appears to be pricing the core cash logistics business at a discount to the sector multiple, reflecting the subsidiary drag on consolidated returns. Whether the market revises that assessment will depend on whether the FY27 subsidiary profitability trajectory management described materialises in the numbers.


6. What’s Cooking

Four material events from the announcements:

Aceware fraud (April 15, 2026 announcement): The subsidiary detected unauthorised domestic money transfer transactions by a former employee, running from July 2025 through February 2026. The estimated exposure was ₹3.13 crore, booked as an exceptional item in the consolidated FY26 results. The filing states system restrictions have been implemented. On the concall, management said investigations have identified the culprit, with “the most important culprit at large” and recovery described as uncertain.

IDBI cash-van contract (February 11, 2026 announcement): The company received a Letter of Intent from IDBI for a cash-van contract of approximately ₹35 crore over three years (April 1, 2026 to March 31, 2029). Management referred to this on the concall as the large project beginning April 1, estimating it at roughly 3–4% of FY27 annual revenue.

RPF related-party transactions (February 25, 2026 announcement): Postal ballot sought shareholder approval for related-party transactions with Radiant Protection Force Private Limited — ₹125 crore in FY27, ₹160 crore in FY28, and ₹200 crore in FY29. The company had also previously disclosed a ₹6 crore inter-corporate deposit to RPF in September 2024.

CMD share purchase (June 10, 2026 announcement): Chairman and Managing Director Col. David Devasahayam purchased 30,037 shares through open market transactions on June 8, 2026, at ₹11.67 lakh in aggregate value, lifting his direct holding to 48.98%.


7. Balance Sheet

Figures consolidated, in ₹ crore.

ItemMar 2024Mar 2025Mar 2026
Total Assets315425508
Net Worth253273278
Borrowings33117194
Other Liabilities293536
Total Liabilities315425508

Assets balance liabilities per column: ✓

Three observations from the numbers:

  • Borrowings have expanded nearly sixfold over two years, from ₹33 crore to ₹194 crore. The standalone filing clarifies that the bulk sits in short-term borrowings (₹150 crore standalone at March 2026 vs ₹89 crore the prior year) — the nature of the cash management business requires significant working capital, as client funds in transit flow through company accounts.
  • Net worth growth has essentially stalled: ₹273 crore to ₹278 crore over FY26, a ₹5 crore increment against ₹28 crore in earned profits — the dividend payout of ₹26.7 crore accounted for the gap, plus subsidiary losses absorbed through the non-controlling interest line.
  • “Other Financial Assets” ballooned on the standalone balance sheet from ₹24 crore to ₹107 crore — the filing shows this reflects fixed deposit investments and the ICD to RPF, consistent with management’s statement of approximately ₹60 crore in free cash and further amounts in fixed deposits.

Management stated on the concall that the company holds approximately ₹100 crore in its own cash with free cash of approximately ₹60 crore as of March 2026.

A balance sheet built on the peculiar logic of the cash management business: the company holds enormous quantities of other people’s money (₹203 crore in funds held for cash management activity, per the standalone cash flow statement), which inflates assets without inflating net worth.


8. Cash Flow: Sab Number Game Hai

Figures consolidated, in ₹ crore.

YearOperatingInvestingFinancing
FY24418-20
FY2543-2453
FY2618-3838

Operating cash flow halved in FY26, from ₹43 crore to ₹18 crore, against a profit before tax of ₹32.6 crore. Working capital absorption — particularly in other financial assets and trade receivables — consumed the gap between accounting profit and cash generated.

Investing activities have turned consistently negative: the company has been deploying capital into fixed deposits (₹39.6 crore net in FY26 alone, per the consolidated cash flow) and subsidiary loans, while capex on property and equipment remains modest at ₹3.5 crore.

Financing is being supported by short-term borrowings: ₹69.9 crore net increase in FY26, funding the dividend and the subsidiary capital requirements. The dividend itself cost ₹26.7 crore — the same amount paid in FY25.

The business that generated ₹41 crore in operating cash in FY24 generated ₹18 crore in FY26. The divergence traces to subsidiary cash consumption and working capital on the core. A business that moves other people’s cash finds that its own cash flow is an exercise in triangulation.


9. Ratios: Sexy or Stressy?

RatioValue
ROE12.5%
ROCE9.96%
P/E13x
PAT Margin (consolidated)6.4%
D/E0.70

ROE at 12.5% — the equity is doing respectable, if unexciting, work. The 3-year average of 16% shows where the number sits without the subsidiary drag.

ROCE at 9.96% marks the first time in recent history this ratio has fallen below 10% on a consolidated basis — the FY25 figure was 26%, though that appears to reflect the standalone-dominant character of the prior calculation. The compression reflects return on employed capital being diluted by subsidiary investments that are not yet generating returns.

P/E at 13x sits below the sector median of 18.5x. The ratio is tracking consolidated earnings, which include Aceware losses; the standalone earnings picture carries a higher implied multiple.

PAT margin at 6.4% (consolidated, per presentation) compares to 10.8% in FY25 — a margin halving in one year that, per management attribution, reflects the fintech subsidiary losses.

D/E at 0.70 — leverage has expanded meaningfully. The core business is asset-light; the rising debt reflects working capital needs of the cash-in-transit model and subsidiary funding requirements.

Does the ROCE story change when subsidiary losses exit, or is the core business itself softening? The FY26 numbers raise the question without answering it.


10. P&L Breakdown: Show Me the Money

Figures consolidated, in ₹ crore.

YearRevenueEBITDAPAT
FY243868244
FY254279347
FY264294528

The revenue line tells a story of stagnation: 11% growth in FY25, 0.5% in FY26. Management attributed the deceleration to the railway and e-commerce client losses on the concall, but even backing those out, organic growth on the base was muted — the company handled ₹1,694 billion in cash in FY26, a 1% increase over ₹1,678 billion the prior year.

The EBITDA collapse is the sharper story. From ₹93 crore to ₹45 crore — a ₹48 crore swing — in a business where revenue grew ₹2 crore. Expenses expanded from ₹334 crore to ₹384 crore, a ₹50 crore increase on essentially flat revenues. Per management, the subsidiary P&L — Aceware and RVL — accounts for the bulk of the consolidated EBITDA erosion.

The standalone P&L tells a less dramatic story: revenue ₹401 crore, PAT ₹38 crore. The subsidiaries contributed negative ₹10 crore to consolidated PAT, by the arithmetic above.

FY24 to FY26: revenue grew 11%, PAT fell 36%. The earnings trajectory is the record of a company funding two new businesses from a core that is growing slowly and holding margins with cost discipline, while the new ventures absorb the surplus.


11. Peer Comparison

From Screener’s peer table (Services / Diversified Commercial Services):

CompanyRevenue (Qtr, ₹ Cr)PAT (Qtr, ₹ Cr)P/E
Intl Gemological Institute29617426.7x
Wework India69364113.5x
Inox Green692879.4x
NESCO2529318.6x
Indiabulls40919418.5x
Radiant Cash101313x
Peer Median18.5x

The peer table is a heterogeneous collection — a gemological lab, a co-working operator, a wind-energy services company, an industrial estate, an NBFC — so direct comparison on business fundamentals is limited. The common thread is that these are services companies categorised together by stock-screening convention rather than by economic similarity.

The market pays 13x for Radiant against a group median of 18.5x. Wework India at 113x and Inox Green at 79x are pricing growth expectations that bear no relationship to a cash-transit company’s economics. The more comparable anchors — NESCO and Indiabulls — sit at 18–19x, about 40% above Radiant’s current multiple on much larger operations.

Radiant’s quarterly PAT of ₹3 crore against revenue of ₹101 crore gives a 3% net margin for the quarter — the weakest recent showing. The peer table captures a single difficult quarter rather than the trailing-year picture.


12. Miscellaneous: Shareholding & Promoters

Holder%
Promoters56.92%
Institutions (FII + DII)1.25%
Public41.84%

Promoters: Col. David Devasahayam (48.95%) is the founder, Chairman, and Managing Director — a former Indian Army colonel with a Harvard OPM credential and 16 years at the company. Dr. Renuka David (7.97%) is a founder director and whole-time director, with a medical background and prior association with Apollo Hospitals and the Assam Rifles. Alexander David is a whole-time director handling operations and business development. The management team is notably military-heavy: the COO is a retired colonel, the Director of Audit is a retired Wing Commander, and approximately 21% of total staff are ex-armed forces.

The institutional holding picture has undergone quiet erosion: FII stake has fallen from 7.56% in June 2023 to 0.30% by March 2026. DII holding has contracted from 25.46% to 0.95% over the same period. The public holding, correspondingly, has expanded from 10.08% to 41.84%.

As for the promoter roast: the board approved Col. David’s re-appointment as CMD through 2028 in August 2023 — a board he chairs approving the tenure of the man who chairs it. The RPF-related party transactions (₹125 crore in FY27, scaling to ₹200 crore by FY29), requiring postal ballot, sit alongside an ICD previously extended to Radiant Protection Force. The related-party universe is compact and familiar.


13. Corporate Governance: Angels or Devils?

The statutory auditor is ASA & Associates LLP, Chartered Accountants (ICAI Firm Registration No. 009571N/N500006), Chennai. The audit opinion for both standalone and consolidated FY26 results is unmodified. Internal audit is handled by Menon & Pai, Chartered Accountants, re-appointed for FY27 per the board meeting outcome filed May 29, 2026.

The Aceware fraud — ₹3.13 crore, classified as an exceptional item — is a governance event worth recording. Per the filing, certain unauthorised and fraudulent transactions were identified in Aceware’s operations, the result of unauthorised system access by a former employee in collusion with external parties. The filing states the company has taken “immediate and comprehensive actions, including system restrictions.” An external forensic review was conducted. The concall noted that investigations have identified the culprit, with the key suspect still at large and recovery uncertain. The full amount has been provided in the books.

No director resignations appear in the announcements during the period. No pledging of promoter shares is reported — pledged percentage is 0.00%. The MOA was amended in December 2025 to add payment aggregator and gateway business, pending RBI approvals, per the shareholder meeting announcement.

The RPF-related party transaction disclosures, the Aceware fraud, and the ICD to RPF form a governance file that is active rather than clean, though none individually constitutes a modified audit opinion.


14. Industry Roast & Macro Context

India’s cash logistics sector is the business of making sure physical currency — which the country’s population insists on using in quantities that persistently embarrass digital evangelists — actually gets from point A to point B without disappearing. Despite fifteen years of digital payment narratives, RBI data shows currency in circulation growing steadily. The company handled ₹1,694 billion in FY26, approximately 1% more than FY25. Cash, it turns out, is not going anywhere. It just needs a van.

The industry structure is a semi-oligopoly of a handful of national players and many regional ones, competing on price, geography, and — critically — cash loss ratios. A cash logistics company with high losses is not merely unprofitable; it is existentially suspicious. The industry consolidation story is real: Radiant’s Tier 2 and Tier 3+ focus insulates it from metro competition while the company expands its client base toward smaller cooperative banks and rural banks, which the big logistics players don’t serve efficiently.

The sector’s regulatory tail-risk is RBI-driven: currency replacement cycles (the culling of soiled notes), which generate volumes, and any future policy on digital mandates, which remains the perpetual existential threat that perpetually fails to materialise. Meanwhile, the industry association, per the concall, has approached client banks to pass through fuel cost increases — the most human of industry lobbying efforts: asking your own customers to pay more for the petrol in your vans.

The fintech adjacency that Radiant is pursuing — POS, sound boxes, business correspondents — is the sector’s version of a college student acquiring a second hobby. The PIDF subsidy that funded much of this deployment ended in December 2025. What remains is the question of whether transaction revenue from installed devices replaces the subsidy fast enough to cover the burn. The industry has been asking that question about fintech for a decade.


15. EduInvesting Verdict

**StrengthsWeaknesses**
Pan-India Tier 2/3+ distribution moat: 77,521 touch points, 14,844 pin codes, difficult to replicate quicklyConsolidated earnings under pressure from two loss-making subsidiaries absorbing core business surplus
Industry-leading cash loss ratio of 0.002% of volumes handledBorrowings expanded from ₹33 Cr to ₹194 Cr in two years; free cash flow halved
Stable, recurring revenue model with long-standing bank relationshipsFII and DII holdings eroding steadily; public float expanding as institutions exit
Military-trained workforce and risk management cultureAceware fraud ₹3.13 Cr — governance event at the subsidiary level
**OpportunitiesThreats**
IDBI three-year dedicated cash-van contract (₹35 Cr) live from April 2026Railway and e-commerce client losses demonstrate the sector’s real churn risk
Direct client mix target of 30% (from 18%) improves margin structure if achieved, management saidSubsidiary path to profitability is management-guided, not yet numbers-confirmed
Cooperative and rural bank expansion opens a distribution channel the company is designed forDividend payout of 83% in a year of earnings compression leaves limited reinvestment buffer
Acemoney pivot from subsidy to transaction revenue — low incremental cost on existing installed basePIDF subsidy removal permanently altered Aceware’s cost-revenue equation

A core that hasn’t lost its footing, a balance sheet that has been drafted to fund two bets, and a dividend policy that moves faster than the earnings that justify it — FY26 is the year Radiant’s ambition became visible in the numbers, and not entirely in the way management intended.