1. At a Glance
A tiny ₹113 crore FMCG upstart making chakki atta, pulses, spices, and mustard oil under the brand ‘HARIOM’—Hoac Foods is grinding hard and selling spicy dreams in Delhi-NCR. With 34% ROE, 69% sales growth, and a P/E of 45, this stock smells like masala and premium pricing.
2. Introduction with Hook
If Patanjali and MDH had a startup baby in Delhi’s backyard, it would look like Hoac Foods. Think flour mills, turmeric dust, and yellow mustard oil flowing like champagne at an Ambani wedding.
- Revenue grew from ₹15.6 Cr in FY24 to ₹26.5 Cr in FY25—up 69%.
- Net profit 2.5x-ed in one year from ₹1.02 Cr to ₹2.5 Cr.
- ROCE = 37%, ROE = 34%, but debtor days = 116. Oops.
The company may be tiny, but it’s swinging for the big leagues with exports, QIPs, and mustard ambitions.
3. Business Model (WTF Do They Even Do?)
Hoac Foods is your neighborhood kirana store’s best friend. Here’s their simple but spicy formula:
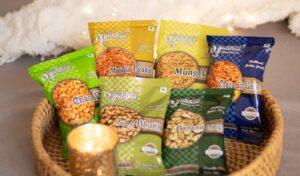
- Core Products: Chakki Atta, Mustard Oil, Dal, Spices, Grains.
- Brand: All sold under “Hariom” through exclusive brand outlets in Delhi-NCR.
- New Moves: Recently began exporting ₹1 Cr worth of FMCG to the UK and appointed Kailash Foods for black mustard oil production.
- Distribution: Limited to Delhi-NCR for now, but eyeing nationwide and overseas expansion.
- Revenue Source: 100% FMCG retail. No distractions. No real estate. No crypto mining.
4. Financials Overview
Revenue, Profit, and Margin Party:
| Year | Sales (₹ Cr) | Net Profit (₹ Cr) | OPM (%) | PAT Margin (%) |
|---|---|---|---|---|
| FY21 | 7.42 | 0.13 | 5.26 | 1.8 |
| FY22 | 10.87 | 0.27 | 5.24 | 2.5 |
| FY23 | 12.10 | 0.50 | 9.75 | 4.1 |
| FY24 | 15.63 | 1.02 | 11.71 | 6.5 |
| FY25 | 26.48 | 2.50 | 15.52 | 9.4 |
- 3-Year Sales CAGR: 35%
- 3-Year PAT CAGR: 110%
- Roasting Cashflows?: Sadly, yes. Negative CFO since FY23.
5. Valuation
Let’s cook up a fair value range using:
a) PE Method (conservative)
- EPS FY25 = ₹6.5
- Assigning P/E range: 25x to 40x (small-cap FMCG range)
→ FV = ₹162 to ₹260
b) EV/EBITDA Method
- EBITDA FY25 = ₹4.11 Cr
- Assume EV/EBITDA = 18x to 25x
→ EV = ₹74 Cr to ₹103 Cr
→ Equity value (after subtracting ₹4.5 Cr debt) ≈ ₹70–₹99 Cr
→ Per share FV = ₹183 to ₹260
Fair Value Range: ₹160 to ₹260
Current Price: ₹261
Verdict: Fully priced like Maggi at airport counters.
6. What’s Cooking – News, Triggers, Drama
- UK Entry: ₹1 Cr FMCG exports = credibility booster.
- Black Mustard Oil Tie-up: 3,000 litres sold in week 1 = niche aggression.
- QIP in July 2025: ₹10 Cr raised at ₹201/share = institutional confidence.
- Promoter Stake Dip: From 70.1% to 62.08% = something brewing?
- IPO Hype Residue: SME darlings often overheat, then cool like stale parathas.
7. Balance Sheet
| Item | Mar ’23 | Mar ’24 | Mar ’25 |
|---|---|---|---|
| Equity Capital | 0.22 | 2.69 | 3.84 |
| Reserves | 1.27 | 0.66 | 7.55 |
| Borrowings | 1.94 | 2.26 | 4.47 |
| Total Assets | 4.90 | 7.97 | 20.24 |
Key Points:
- Total assets 4x in 2 years = fast expansion.
- Debt up from ₹2.2 Cr to ₹4.5 Cr = mild leverage.
- Net worth now at ₹11.4 Cr post-QIP.
8. Cash Flow – Sab Number Game Hai
| FY | CFO (₹ Cr) | CFI (₹ Cr) | CFF (₹ Cr) | Net Flow |
|---|---|---|---|---|
| FY23 | -0.51 | -0.34 | +0.59 | -0.26 |
| FY24 | -0.29 | -0.43 | +0.83 | +0.11 |
| FY25 | -1.19 | -3.21 | +7.27 | +2.87 |
Insights:
- Profits are growing. Cash isn’t.
- Heavy capex + working capital = negative CFO
- Financing activity (QIP, debt) is keeping the lights on.
9. Ratios – Sexy or Stressy?
| Ratio | FY23 | FY24 | FY25 |
|---|---|---|---|
| ROE (%) | 36.4 | 37.6 | 33.9 |
| ROCE (%) | 37.7 | 37.6 | 37.1 |
| Debtor Days | 31.1 | 52.8 | 116.5 |
| Inventory Days | 96.5 | 135.7 | 80.6 |
| Payables Days | 43.9 | 61.1 | 66.5 |
| Cash Conversion | 83.7 | 127.3 | 130.6 |
Takeaway: ROE hot, but debtors cooler than your fridge.
10. P&L Breakdown – Show Me the Money
| Year | Sales | EBITDA | EBITDA % | Net Profit | PAT % |
|---|---|---|---|---|---|
| FY23 | 12.10 | 1.18 | 9.75% | 0.50 | 4.1% |
| FY24 | 15.63 | 1.83 | 11.7% | 1.02 | 6.5% |
| FY25 | 26.48 | 4.11 | 15.5% | 2.50 | 9.4% |
Margins expanding like a buttered paratha.
11. Peer Comparison
| Company | MCap (Cr) | P/E | ROE (%) | OPM (%) | Sales (Cr) | PAT (Cr) |
|---|---|---|---|---|---|---|
| Hoac Foods | 113 | 45.4 | 33.9 | 15.5 | 26.5 | 2.50 |
| Freshara Agro | 472 | 16.4 | 37.2 | 24.2 | 250.6 | 17.4 |
| Krishival Foods | 875 | 64.6 | 10.5 | 10.5 | 202.2 | 5.25 |
| Megastar Foods | 311 | 82.3 | 4.1 | 6.2 | 350.1 | 1.35 |
Conclusion: Among peers, Hoac is a profit-efficient microcap—small but churning strong ROE.
12. Miscellaneous – Shareholding, Promoters
| Category | Mar ’25 | Jul ’25 |
|---|---|---|
| Promoters | 70.1% | 62.1% |
| FIIs | 0% | 2.85% |
| DIIs | 0% | 8.61% |
| Public | 29.9% | 26.5% |
- QIP led dilution = Promoter stake fell
- FIIs + DIIs entering = Institutional validation
13. EduInvesting Verdict™
Hoac Foods is one of those SME players that look suspiciously healthy—like the turmeric latte you regret mocking. Its brand outlet model is still in the NCR sandbox, but the numbers show ambition and execution both working together (for now). While cash flow’s in the ICU, net profit margins are flexing. At ₹261, it’s fully priced, but in FMCG—a little spice goes a long way.
Verdict: Not a moonshot. But certainly not maida either.
Metadata
– Written by EduInvesting Research Team | July 13, 2025
– Tags: HOAC Foods, FMCG, SME Stocks, Delhi-NCR Brands, Hariom Atta, Microcap Movers, Hoac Foods


