1. At a Glance – The Zinc Sultan of India (and Silver Hoarder Too)
Let’s not waste time pretending this is some niche midcap mining experiment. Hindustan Zinc Ltd (HZL) is a cash-gushing, margin-flexing, dividend-throwing behemoth sitting right in Rajasthan, casually owning ~75% of India’s zinc market while also moonlighting as the world’s 3rd largest silver producer.
Market cap? ₹2.79 lakh crore. Stock price? ₹660 (up ~36% in 3 months, because metals + dividends = investor dopamine). ROCE? ~61% (illegal in some countries). ROE? ~72% (even banks are blushing). Dividend yield? ~4.4% (basically an FD with muscles).
Q3 FY26 came in hot: Revenue ₹10,980 Cr (+27.6% YoY), PAT ₹3,916 Cr (+45.8% YoY), EBITDA margin pushing 55%. This is not cyclical pain — this is cyclical domination.
But before you get carried away thinking this is a “safe PSU-style metal play”, remember: 90% of promoter shares are pledged, the Government still holds ~28%, and the parent is Vedanta Limited — a group that treats dividends like oxygen and balance sheets like optional accessories.
Curious how deep this zinc rabbit hole goes? Let’s dig. ⛏️
2. Introduction – When a Mining Company Behaves Like a Cash Cow Unicorn
Mining companies are supposed to be dirty, cyclical, capital-hungry, and emotionally unavailable. Hindustan Zinc looked at that stereotype and said: “Hold my silver bar.”
Incorporated in 1966, HZL today runs some of the largest underground zinc mines globally, led by the legendary Rampura Agucha. Unlike your average metal producer who cries every time commodity prices sneeze, HZL has stacked the deck in its favour: high-grade reserves, backward integration, captive power, and ruthless cost control.
The result? 12 consecutive quarters of lowest zinc cost of production globally (Q4 FY24 highlight). When zinc prices fall, competitors bleed. HZL shrugs and pays dividends.
But this isn’t just a zinc story. Revenue mix FY24:
Zinc: ~62%
Lead: ~14%
Silver: ~19%
Others: ~5%
Silver, by the way, is not a side hustle. With ~746 MT saleable silver in FY24 and recovery projects scaling up, HZL is quietly turning into a precious metals hedge hiding inside a base metals stock.
Add to that:
25% exports
25+ years of mine life
Aggressive capex + renewable power transition
Possible demerger into Zinc/Lead, Silver, Recycling verticals
This is not just mining. This is mining with optionality. And some drama. Ready? 😏
3. Business Model – WTF Do They Even Do (Besides Digging Money)?
At its core, Hindustan Zinc does three things:
Dig metal out of the earth
Refine it at obscene margins
Send cash to shareholders before anyone asks questions
Mining
HZL operates integrated underground and open-cast mines across Rajasthan:
Rampura Agucha
Sindesar Khurd
Zawar
Kayad
Bamnia Kalan (coming up)
These mines feed high-grade ore into in-house smelters, which is key. No begging third parties. No margin leakage.
Smelting & Refining
Smelting capacity:
Zinc: ~913,000 TPA
Lead: ~210,000 TPA
Silver: ~800 TPA
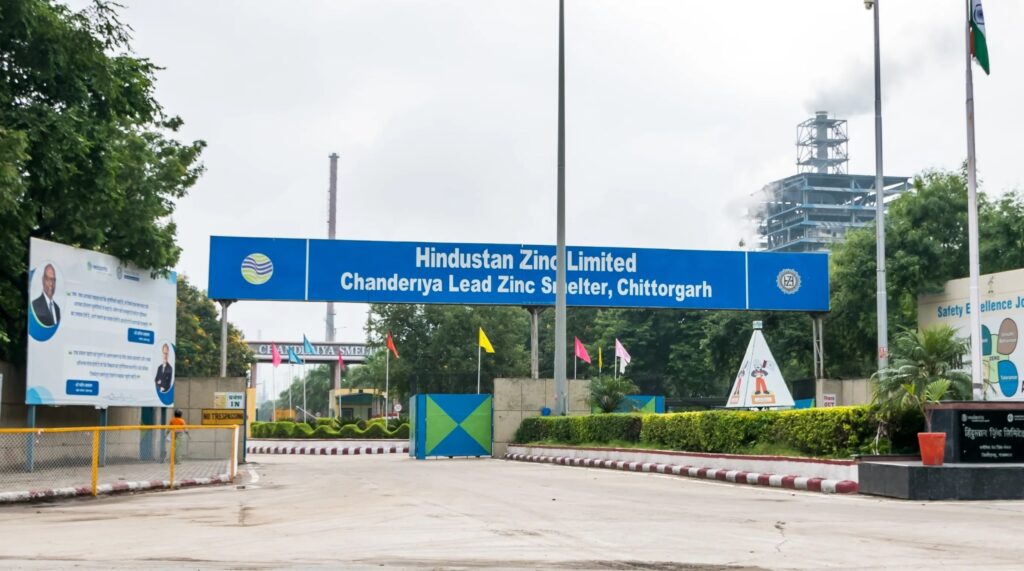
Facilities at Chanderiya, Dariba, Debari, Pantnagar ensure full vertical integration. This is why HZL’s OPM sits north of 50% while global peers fight for 20–30%.
Power & Sustainability
HZL is self-sufficient in power, running captive thermal plants while also:
Adding wind power
Signing PDA agreements with Serentica Renewable for 450 MW round-the-clock green power